10-K: Annual report pursuant to Section 13 and 15(d)
Published on June 22, 2020
UNITED STATES
SECURITIES AND EXCHANGE COMMISSION
Washington, D.C. 20549
______________________________
FORM 10-K
______________________________
ANNUAL REPORT PURSUANT TO SECTION 13 OR 15(d) OF THE SECURITIES EXCHANGE ACT OF 1934 |
|
For the fiscal year ended December 31, 2019
or
TRANSITION REPORT PURSUANT TO SECTION 13 OR 15(d) OF THE SECURITIES EXCHANGE ACT OF 1934 |
|
For the transition period from to
Commission File Number: 001-38035
______________________________
(Exact name of registrant as specified in its charter)
______________________________
|
(State or other jurisdiction of
incorporation or organization)
|
(I.R.S. Employer
Identification No.)
|
(Address of principal executive offices)
Registrant’s telephone number, including area code: (432 ) 688-0012
Securities registered pursuant to Section 12(b) of the Act:
Title of each class |
Trading Symbol(s) |
Name of each exchange on which registered |
N/A |
||
Securities registered pursuant to Section 12(g) of the Act:
None
______________________________________________________
Indicate by check mark if the registrant is a well-known seasoned issuer, as defined in Rule 405 of the Securities Act. Yes ¨ No ý
Indicate by check mark if the registrant is not required to file reports pursuant to Section 13 or Section 15(d) of the Act. Yes ¨ No ý
Indicate by check mark whether the registrant (1) has filed all reports required to be filed by Section 13 or 15(d) of the Securities Exchange Act of 1934 during the preceding 12 months (or for such shorter period that the registrant was required to file such reports), and (2) has been subject to such filing requirements for the past 90 days. Yes ¨ No ý
Indicate by check mark whether the registrant has submitted electronically every Interactive Data File required to be submitted pursuant to Rule 405 of Regulation S-T (§232.405 of this chapter) during the preceding 12 months (or for such shorter period that the registrant was required to submit such files). Yes ¨ No ý
Indicate by check mark whether the registrant is a large accelerated filer, an accelerated filer, a non-accelerated filer, smaller reporting company, or an emerging growth company. See the definitions of “large accelerated filer,” “accelerated filer,” “smaller reporting company” and "emerging growth company" in Rule 12b-2 of the Exchange Act.
ý
|
Accelerated filer |
☐ |
||||
Non-accelerated filer |
☐(Do not check if a smaller reporting company)
|
Smaller reporting company |
||||
Emerging growth company |
||||||
If an emerging growth company, indicate by check mark if the registrant has elected not to use the extended transition period for complying with any new or revised financial accounting standards provided pursuant to Section 13(a) of the Exchange Act. ☐
Indicate by check mark whether the registrant has filed a report on and attestation to its management’s assessment of the effectiveness of its internal control over financial reporting under Section 404(b) of the Sarbanes-Oxley Act (15 U.S.C. 7262(b)) by the registered public accounting firm that prepared or issued its audit report. ý
Indicate by check mark whether the registrant is a shell company (as defined in Rule 12b-2 of the Exchange Act). Yes ☐ No ý
The aggregate market value of the Company’s Common Stock held by nonaffiliates on June 30, 2019, determined using the per share closing price on the New York Stock Exchange Composite tape of $20.70 on that date, was approximately $1,492.4 million.
The number of the registrant’s common shares, par value $0.001 per share, outstanding at June 9, 2020, was 100,849,840 .
TABLE OF CONTENTS
EXPLANATORY NOTE
Audit Committee Internal Review
In May 2019, the Audit Committee (the “Committee”) of ProPetro Holding Corp.’s (the “Company”) board of directors (the “Board”), with assistance of independent outside counsel and accounting advisors, began conducting an internal review initially focused on the Company’s disclosure of agreements previously entered into with AFGlobal Corporation for the purchase of Durastim® hydraulic fracturing fleets and effective communications related thereto. The review was later expanded (collectively, the “Expanded Audit Committee Review”) to, among other items, review expense reimbursements, certain transactions involving related parties or potential conflicts of interest, and certain transactions entered into by our former chief executive officer.
Findings of the Expanded Audit Committee
Based on the information collected and reviewed by the Committee’s independent outside counsel and accounting advisors, the Expanded Audit Committee Review resulted in numerous factual findings, including but not limited to, the following significant findings:
• |
approximately $370,000 of expenses reimbursed to members of senior management, including the former chief executive officer (approximately $346,000) and former chief financial officer (approximately $18,000), were incorrectly recorded as expenses of the Company and should have been the responsibility of the officers individually; each of these officers has reimbursed the Company in full for the identified amounts. These improper reimbursements were attributable to inadequate documentation stemming from the lack of a more robust employee expense review and approval procedure; |
• |
the Company’s former chief accounting officer entered into a related party transaction that was not properly disclosed in the Company’s filings with the Securities and Exchange Commission (the “SEC”); |
• |
a number of internal and disclosure control deficiencies and material weaknesses were identified, as described in more detail in Part II - Item 9A. “Controls and Procedures,” including, but not limited to, the following: |
◦ |
the Company’s former executive management team did not establish and promote a control environment with an appropriate tone of compliance and control consciousness throughout the entire Company; |
◦ |
the Company did not appropriately identify and monitor conflicts of interest; |
◦ |
certain whistleblower allegations were not properly investigated and elevated to the Committee; |
◦ |
instances were identified of non-compliance with the Company’s internal policies, including its Insider Trading Compliance Policy and Code of Conduct and Ethics; and |
◦ |
management did not appropriately communicate information internally and externally, including communication between management and the Board. |
The Expanded Audit Committee Review did not identify any material accounting errors in the Company’s consolidated financial statements, and no restatement or revision was required of the Company’s consolidated financial statements previously reported in the Company’s Annual Report on Form 10-K for the year ended December 31, 2018 (the “2018 Annual Report”) and its Quarterly Report on Form 10-Q for the quarter ended March 31, 2019 (the “2019 First Quarter 10-Q”).
Following completion of the Expanded Audit Committee Review and in connection with performing additional procedures to position the Company’s current principal executive and principal financial officers to be in a position to certify the Company’s future filings with the SEC, the Company determined that its former chief executive officer entered into a pledge agreement covering all of the Company’s common stock owned by him at
ii
that time as collateral for a personal loan in January 2017, in violation of the shareholders agreement then in place through the pledging of shares. The Company formally adopted its Insider Trading Compliance Policy in March 2017 (in connection with its initial public offering), which prohibits pledging the Company’s securities as collateral to secure loans. The Company also believes that, in 2018 in connection with another personal loan, its former chief executive officer executed a share pledge agreement that was subsequently replaced with a negative pledge with respect to all of the Company’s common stock owned by him at that time or acquired thereafter and engaged in other inappropriate conduct in connection with these personal loans. The Company did not appropriately disclose such pledges in the Company’s prior SEC filings that included management share ownership. Also in connection with performing additional procedures, the Company determined that it had previously failed to appropriately disclose in its annual proxy statements certain perquisites as compensation paid to some of the Company’s named executive officers in 2017 and 2018, including, among other later reimbursed perquisites, ticket purchases, charitable donations, and costs associated with pilots provided by the Company for its former chief executive officer’s personal use of his plane. See "Executive Compensation—Summary Compensation Table" and "Executive Compensation—Narrative Disclosure to Summary Compensation Table and Grants of Plan-Based Awards Table—Perquisites" for more information regarding these perquisites.
Internal Control over Financial Reporting and Disclosure Controls and Procedures
As a result of the material weaknesses in the Company’s internal control over financial reporting described above and as further described in Part II - Item 9A. “Controls and Procedures,” the Company concluded that (i) its disclosure controls and procedures were not effective as of December 31, 2019 and 2018 and March 31, June 30 and September 30, 2019 and (ii) its internal control over financial reporting was not effective as of December 31, 2019 and 2018. Due to the existence of such material weaknesses, the Company’s internal control over financial reporting remained ineffective as of March 31, June 30 and September 30, 2019. The Company previously announced on November 13, 2019 that investors should no longer rely on management’s report on internal control over financial reporting or the internal control over financial reporting opinion of the Company’s independent registered public accounting firm included in the 2018 Annual Report. The conclusions regarding effectiveness previously expressed by the Company’s former management in Part II, Item 9A, “Controls and Procedures” in the 2018 Annual Report and Part I, Item 4, “Controls and Procedures” in the 2019 First Quarter 10-Q are hereby amended by the conclusions expressed in Part II - Item 9A. “Controls and Procedures” of this Annual Report on Form 10-K. In light of the disclosures herein, the Company does not intend to file amendments to the 2018 Annual Report or the 2019 First Quarter 10-Q to reflect these conclusions.
Remediation Plan
The Company’s remediation efforts are ongoing, and it will continue its initiatives to implement and document policies, procedures, and internal controls. The Board and management have implemented a number of measures to address the material weaknesses identified, including appointing new executive officers with extensive public company experience; enhancing certain of the Company’s policies and monitoring compliance with such policies; designing and implementing control activities related to the identification and approval of related party transactions and potential conflicts of interest, as well as the evaluation of whistleblower allegations; forming a disclosure committee and appointing a chief disclosure officer. The Company’s remediation efforts are described in more detail in Part II - Item 9A. “Controls and Procedures.”
iii
FORWARD‑LOOKING STATEMENTS
This Annual Report on Form 10-K (the “Annual Report”) contains forward‑looking statements. Statements that are predictive in nature, that depend upon or refer to future events or conditions or that include the words “may,” “could,” “plan,” “project,” “budget,” “predict,” “pursue,” “target,” “seek,” “objective,” “believe,” “expect,” “anticipate,” “intend,” “estimate,” and other expressions that are predictions of, or indicate, future events and trends and that do not relate to historical matters identify forward‑looking statements. Our forward‑looking statements include, among other matters, statements about our business strategy, industry, future profitability, expected capital expenditures and the impact of such expenditures on our performance and capital programs.
A forward‑looking statement may include a statement of the assumptions or bases underlying the forward‑looking statement. We believe that we have chosen these assumptions or bases in good faith and that they are reasonable. You are cautioned not to place undue reliance on any forward‑looking statements. You should also understand that it is not possible to predict or identify all such factors and should not consider the following list to be a complete statement of all potential risks and uncertainties. Factors that could cause our actual results to differ materially from the results contemplated by such forward‑looking statements include:
• |
the severity and duration of world health events, including the recent outbreak of the novel coronavirus (“COVID-19”) pandemic, related economic repercussions and the resulting severe disruption in the oil and gas industry and negative impact on demand for oil and gas, which is negatively impacting our business; |
• |
the current significant surplus in the supply of oil and actions by the members of the Organization of the Petroleum Exporting Countries (“OPEC”) and Russia (together with OPEC and other allied producing countries, “OPEC+”) with respect to oil production levels and announcements of potential changes in such levels, including the ability of the OPEC+ countries to agree on and comply with supply limitations; |
• |
uncertainty regarding the timing, pace and extent of an economic recovery in the United States and elsewhere, which in turn will likely affect demand for crude oil and natural gas and therefore the demand for our services; |
• |
the level of production and resulting market prices for crude oil, natural gas and other hydrocarbons; |
• |
changes in general economic and geopolitical conditions; |
• |
competitive conditions in our industry; |
• |
changes in the long-term supply of, and demand for, oil and natural gas; |
• |
actions taken by our customers, suppliers, competitors and third-party operators; |
• |
changes in the availability and cost of capital; |
• |
our ability to successfully implement our business plan; |
• |
large or multiple customer defaults, including defaults resulting from actual or potential insolvencies; |
• |
the price and availability of debt and equity financing (including changes in interest rates); |
• |
our ability to complete growth projects on time and on budget; |
• |
operational challenges relating to the COVID-19 pandemic and efforts to mitigate the spread of the virus, including logistical challenges, protecting the health and well-being of our employees, remote work arrangements, performance of contracts and supply chain disruptions; |
• |
changes in our tax status; |
• |
technological changes; |
• |
our ability to successfully implement technological developments and enhancements, including the new DuraStim® fleets and associated power solutions;
|
• |
operating hazards, natural disasters, weather-related delays, casualty losses and other matters beyond our control; |
• |
acts of terrorism, war or political or civil unrest in the United States or elsewhere; |
iv
• |
the effects of existing and future laws and governmental regulations (or the interpretation thereof); |
• |
the effects of current and future litigation, including the Logan Lawsuit, the Boca Raton Lawsuit and the Chang Lawsuit (each defined herein); |
• |
the timing and outcome of, including potential expense associated with, the SEC pending investigation; |
• |
the potential impact on our business and stock price of any announcements regarding the SEC's pending investigation, the Logan Lawsuit, the Boca Raton Lawsuit or the Chang Lawsuit; |
• |
the material weaknesses in our internal controls over financial reporting and disclosure controls and procedures described under Part I, Item 9, “Controls and Procedures” in this Annual Report; |
• |
matters related to the Expanded Audit Committee Review and related findings, as well as the implementation and effectiveness of the Company's remediation plan; and |
• |
our ability to successfully execute on our plans and objectives. |
You should not place undue reliance on our forward‑looking statements. Although forward‑looking statements reflect our good faith beliefs at the time they are made, forward‑looking statements involve known and unknown risks, uncertainties and other factors, including the factors described under “Item 1A. Risk Factors” of this Annual Report, which may cause our actual results, performance or achievements to differ materially from anticipated future results, performance or achievements expressed or implied by such forward‑looking statements. We undertake no obligation to publicly update or revise any forward‑looking statement, whether as a result of new information, future events, changed circumstances or otherwise, unless required by law.
Unless the context indicates otherwise, all references to “ProPetro Holding Corp.,” “the Company,” “we,” “our” or “us” or like terms refer to ProPetro Holding Corp. and its consolidated subsidiary, ProPetro Services, Inc.
v
PART I
Item 1. Business.
Our Company
We are a growth‑oriented, Midland, Texas‑based oilfield services company providing hydraulic fracturing and other complementary services to leading upstream oil and gas companies engaged in the exploration and production (“E&P”) of North American unconventional oil and natural gas resources. Our operations are primarily focused in the Permian Basin, where we have cultivated longstanding customer relationships with some of the region’s most active and well‑capitalized E&P companies. The Permian Basin is widely regarded as one of the most prolific oil‑producing areas in the United States, and we believe we are one of the leading providers of hydraulic fracturing services in the region by hydraulic horsepower (“HHP”).
Changes to our customers’ well design, shale formations, operating conditions and new technology have resulted in continuous changes to the number of pumps that constitute a fleet. As a result of the asymmetric nature of the number of pumps that constitute a fleet across our customer base, which we believe will continue to evolve, we view HHP to also be an appropriate metric to measure our available hydraulic fracturing capacity. At the beginning of the year, our fleet size was 28 conventional hydraulic fracturing fleets. During 2019, we reconfigured our existing fleet size to 24 conventional fleets with the objective of increasing our HHP per fleet, and we subsequently purchased 54,000 HHP of new DuraStim® hydraulic pumps, bringing our total HHP at December 31, 2019 to 1,469,000 HHP. Our total HHP as of December 31, 2019 was comprised of 1,415,000 HHP of conventional HHP and 54,000 HHP of our newly purchased DuraStim® hydraulic fracturing technology. With the continuous evaluation and changes to the number of pumps or HHP that constitute a fleet, we believe that our available fleet capacity could decline as we reconfigure our fleets to increase active HHP and back up HHP based on our customers’ operational needs.
In 2019, we entered into a purchase commitment for 108,000 HHP DuraStim® hydraulic fracturing pumps. We believe that one DuraStim® fleet could require between 6 to 9 frac pumps or 36,000 to 54,000 HHP per fleet, depending on the shale formation in which it operates and the customer’s well design. The first DuraStim® hydraulic fracturing pumps were delivered in December 2019 and the remaining DuraStim® hydraulic fracturing pumps are expected to be delivered in 2020. We also have an option to purchase up to three additional DuraStim® fleets in the future through April 2021. We believe the DuraStim® hydraulic fracturing pump technology could represent the future of our industry and is designed to drive down well costs for our customers while improving safety and the useful life of the equipment and reducing environmental impact. The DuraStim® technology is powered by electricity. We purchased two gas turbines to provide electrical power for our DuraStim® fleets. The electrical power sources for future DuraStim® fleets are still being evaluated and could either be supplied by the Company, customers or a third-party supplier.
All of our hydraulic fracturing fleets have been designed to handle the most challenging Permian Basin operating conditions and the region’s increasingly high‑intensity well completions, which are characterized by longer horizontal wellbores, more frac stages per lateral and increasing amounts of proppant per well.
In addition to our core pressure pumping segment operations, which includes our cementing operations, we also offer a suite of complementary well completion and production services, including coiled tubing and other services. We believe these complementary services create operational efficiencies for our customers and could allow us to capture a greater portion of their capital spending across the lifecycle of a well.
Commodity Price and Other Economic Conditions
The global public health crisis associated with the COVID-19 pandemic has and is anticipated to continue to have an adverse effect on global economic activity for the immediate future and has resulted in travel restrictions, business closures and the institution of quarantining and other restrictions on movement in many communities. The slowdown in global economic activity attributable to COVID-19 has resulted in a dramatic decline in the demand for energy which directly impacts our industry and the Company. In addition, global crude oil prices experienced a collapse starting in early March 2020 as a direct result of failed negotiations between OPEC and Russia. In response to the global economic slowdown, OPEC had recommended a decrease in production levels in order to accommodate reduced demand. Russia
1
rejected the recommendation of OPEC as a concession to U.S. producers. After the failure to reach an agreement, Saudi Arabia, a dominant member of OPEC, and other Persian Gulf OPEC members announced intentions to increase production and offer price discounts to buyers in certain geographic regions.
As the breadth of the COVID-19 health crisis expanded throughout the month of March 2020 and governmental authorities implemented more restrictive measures to limit person-to-person contact, global economic activity continued to decline commensurately. The associated impact on the energy industry has been adverse and continued to be exacerbated by the unresolved conflict regarding production. In the second week of April 2020, OPEC+ reconvened to discuss the matter of production cuts in light of unprecedented disruption and supply and demand imbalances that expanded since the failed negotiations in early March 2020. Tentative agreements were reached to cut production by up to 10 million barrels of oil per day, or BOPD, with allocations to be made among the OPEC+ participants. Some of these production cuts went into effect in the first half of May 2020, however, commodity prices remain depressed as a result of an increasingly utilized global storage network and near-term demand loss attributable to the COVID-19 health crisis and related economic slowdown.
The combined effect of COVID-19 and the energy industry disruptions led to a decline in WTI crude oil prices of approximately 67 percent from the beginning of January 2020, when prices were approximately $62 per barrel, through the end of March 2020, when they were just above $20 per barrel. Overall crude oil price volatility has continued despite apparent agreement among OPEC+ regarding production cuts and as of June 17, 2020, the WTI price for a barrel of crude oil was approximately $38.
Despite a significant decline in drilling and completion activity by U.S. producers starting in mid-March 2020, domestic supply continues to exceed demand which has led to significant operational stress with respect to capacity limitations associated with storage, pipeline and refining infrastructure, particularly within the Gulf Coast region. The combined effect of the aforementioned factors is anticipated to have a continuing adverse impact on the industry in general and our operations specifically.
In order to mitigate the impact of COVID-19 and the economic effects of the unprecedented decline in economic activity and global energy markets, we undertook several actions since March 2020 in support of the efficient continuity of our operations. These actions are described in greater detail in Part 2, Item 7, “Management’s Discussion and Analysis of Financial Condition and Results of Operations.”
Our Services
We have historically conducted our business through five operating segments: hydraulic fracturing, cementing, coiled tubing, flowback and drilling. For reporting purposes, the hydraulic fracturing and cementing operating segments are aggregated into our one reportable segment: pressure pumping. Our coiled tubing, flowback, and drilling operating segments and corporate administrative expense are aggregated into our “All Other” reportable segment. For additional financial information on our reportable segment, please see reportable segment information in Part II - Item 8. “Financial Statements and Supplementary Data.”
Pressure Pumping
Hydraulic Fracturing
We primarily provide hydraulic fracturing services to E&P companies in the Permian Basin. These services are intended to optimize hydrocarbon flow paths during the completion phase of horizontal shale wellbores. We have significant expertise in multi‑stage fracturing of horizontal oil‑producing wells in unconventional geological formations. We took delivery of 54,000 HHP of new DuraStim® hydraulic fracturing pumps in December 2019, bringing our total fleet capacity to 1,469,000 HHP as of December 31, 2019.
The fracturing process consists of pumping a fracturing fluid into a well at sufficient pressure to fracture the formation. Materials known as proppants, which in our business are comprised primarily of sand, are suspended in the fracturing fluid and are pumped into the fracture to prop it open. The fracturing fluid is designed to “break,” or loosen viscosity, and be forced out of the formation by its pressure, leaving the proppants suspended in the fractures created, thereby increasing the mobility of the hydrocarbons. As a result of the fracturing process, production rates are usually enhanced substantially, thus increasing the rate of return of hydrocarbons for the operator.
We own and operate a fleet of mobile hydraulic fracturing units and other auxiliary equipment to perform fracturing services. We also refer to all of our fracturing units, other equipment and vehicles necessary to perform a fracturing job as
2
a “fleet” and the personnel assigned to each fleet as a “crew.” Our conventional hydraulic fracturing units consist primarily of a high pressure hydraulic pump, diesel engine, transmission and various hoses, valves, tanks and other supporting equipment like blenders, irons and data vans. The new DuraStim® hydraulic fracturing fleet is powered by electricity and the electrical power equipment could either be provided by us or our customers.
We provide dedicated equipment, personnel and services that are tailored to meet each of our customer’s needs. Each fleet has a designated team of personnel, which allows us to provide responsive and customized services, such as project design, proppant and other consumables procurement, real‑time data provision and post‑completion analysis for each of our jobs. Many of our hydraulic fracturing fleets and associated personnel have continuously worked with the same customer for the past several years promoting deep relationships and a high degree of coordination and visibility into future customer activity levels. Furthermore, in light of our substantial market presence and historically high fleet utilization levels, we have established a variety of entrenched relationships with key equipment, sand and other downhole consumable suppliers. These strategic relationships ensure ready access to equipment, parts and materials on a timely and economic basis and allow our dedicated procurement logistics team to ensure consistently safe and reliable operations.
Cementing
We provide cementing services for completion of new wells and remedial work on existing wells. Cementing services use pressure pumping equipment to deliver a slurry of liquid cement that is pumped down a well between the casing and the borehole. Cementing provides isolation between fluid zones behind the casing to minimize potential damage to hydrocarbon bearing formations or the integrity of freshwater aquifers, and provides structural integrity for the casing by securing it to the earth. Cementing is also done when recompleting wells, where one zone is plugged and another is opened.
As of December 31, 2019, we had a total of 25 cementing units. We believe that our cementing segment provides an organic growth opportunity for us to expand our service offerings within our existing customer base.
Other Services
Coiled Tubing
Coiled tubing services involve injecting coiled tubing into wells to perform various completion well intervention operations. Coiled tubing is a flexible steel pipe with a diameter of typically less than three inches and manufactured in continuous lengths of thousands of feet. It is wound or coiled on a truck‑mounted reel for onshore applications. Due to its small diameter, coiled tubing can be inserted into existing production tubing and used to perform a variety of services to enhance the flow of oil or natural gas.
The principal advantages of using coiled tubing include the ability to (i) continue production from the well without interruption, thus reducing the risk of formation damage, (ii) move continuous coiled tubing in and out of a well significantly faster than conventional pipe used with a workover rig, which must be jointed and unjointed, (iii) direct fluids into a wellbore with more precision, allowing for improved stimulation fluid placement, (iv) provide a source of energy to power a downhole motor or manipulate down‑hole tools and (v) enhance access to remote fields due to the smaller size and mobility.
As of December 31, 2019, we had a total of 9 coiled tubing units of various sizes.
Flowback Services
Our flowback services consist of production testing, solids control and hydrostatic testing. Flowback involves the process of allowing fluids to flow from the well following a treatment, either in preparation for an impending phase of treatment or to return the well to production. Our flowback equipment consists of manifolds, accumulators, valves, flare stacks and other associated equipment that combine to form up to a total of five well‑testing spreads. We provide flowback services in the Permian Basin and mid‑continent markets. Our flowback business segment has continued to decline in profitability over the years, and as a result, the Company shut down its flowback operations in 2020 and disposed of the assets.
3
Drilling
Our vertical drilling assets in our drilling segment have been idled since 2016. The Company is considering strategic alternatives for the use of its drilling rigs including exploring options to dispose of the remaining drilling rigs and ancillary assets. If the market for vertical drilling does not improve and the equipment continues to be idled, the estimated fair value for the drilling rigs may decline, thus resulting in future additional impairment charges.
Competitive Strengths
Our primary business objective is to serve as a strategic long-term partner for our customers. We achieve this objective by providing reliable, high‑quality services that are tailored to our customers’ needs and synchronized with their well development programs. This alignment assists our customers in optimizing the long‑term development of their unconventional resources. We believe that the following competitive strengths differentiate us from our peers and uniquely position us to achieve our primary business objective.
• |
Strong market position in the Permian Basin. We believe we are one of the largest hydraulic fracturing providers by HHP in the Permian Basin, which is one of the most prolific oil producing areas in the United States. Our longstanding customer relationships and substantial Permian Basin market presence uniquely position us to maintain our market position and grow as the basin is developed in the future. The Permian Basin is a mature, liquids‑rich basin with well-known geology and a large, exploitable resource base that delivers attractive E&P producer economics. As a result of its significant size, coupled with the presence of multiple prospective geologic benches and other favorable characteristics, the Permian Basin has become widely recognized as one of the most attractive and economic oil resources in North America.
|
Our operational focus has historically been in the Permian Basin’s Midland sub‑basin in support of our customers’ core operations. More recently, however, many of our customers have made sizeable acquisitions in the Delaware sub-basin, and we have expanded our services into the Delaware sub-basin to help develop their acreage. Further, we believe that we are uniquely positioned to capture a large addressable growth opportunity as the basin develops. For the foreseeable future, we expect both the Midland sub-basin and the Delaware sub-basin to continue to command a disproportionate share of future North American E&P spending.
• |
Deep relationships and operational alignment with high‑quality, Permian Basin‑focused customers. Our deep local roots, operational expertise and commitment to safe and reliable service have allowed us to cultivate longstanding customer relationships with the most active and well‑capitalized Permian Basin operators. Many of our current customers have worked with us since our inception and have integrated our fleet scheduling with their well development programs. We have a long-term partnership agreement with one customer, an E&P company focused in the Permian Basin, to continue to provide pressure pumping and other complementary services for up to 10 years. This relationship differentiates us from our peers. This high degree of operational alignment and partnership with our customers has allowed us to maintain relatively high utilization rates over time compared to our peers. If our customers increase activity levels, we expect to continue to leverage our strong relationships to keep our fleets utilized.
|
• |
Proven cross‑cycle financial performance. Over the past several years, we have maintained high cross‑cycle fleet utilization rates. From late 2017 through 2018 our fleets were consistently fully utilized. In 2019, following a decline in certain of our customers’ operations in the last quarter of 2019, our fleets utilization decreased slightly, and our utilization has decreased dramatically in 2020 as a result of COVID-19 and related matters. Historically, our consistent track record of steady growth, coupled with our ability to quickly deploy new HHP on a dedicated and fully utilized basis, has resulted in revenue growth across the industry’s cycles. We believe that we will be able to continue to operate more efficiently than our competitors while preserving attractive profitability and cash flows as a result of our differentiated service offerings and wellsite efficiencies. Furthermore, we believe that our philosophy of maintaining modest financial leverage and a healthy balance sheet has left us more conservatively capitalized than most of our peers. We expect that improving market fundamentals, our superior execution and our customer‑focused approach should continue to result in strong financial performance.
|
• |
Seasoned management and operating team. We have a seasoned executive management team, with our senior members contributing more than 100 years of collective industry and financial experience. We believe their deep roots and relationships throughout the West Texas community, provide a meaningful competitive advantage for our business. In addition, our management team has assembled a loyal group of highly‑motivated and talented managers and field personnel, and we have had minimal manager‑level turnover in our core service divisions
|
4
over the past several years. We employ a balanced decision‑making structure that empowers managerial and field personnel to work directly with customers to develop solutions while leveraging senior management’s oversight. This collaborative approach fosters strong customer links at all levels of the organization and effectively institutionalizes customer relationships beyond the executive suite.
Strategy
Our strategy is to:
• |
Capture an increasing share of demand for hydraulic fracturing services in the Permian Basin. We intend to continue to position ourselves as a Permian Basin‑focused hydraulic fracturing business, as we believe the Permian Basin hydraulic fracturing market offers supportive long‑term growth fundamentals. These fundamentals are characterized by increased demand for our HHP and well completion intensity levels. We have historically operated at a high utilization relative to our peers, and we believe we are strategically positioned to deploy our idle horse-power if overall market condition and demand for pressure pumping services increases.
|
• |
Capitalize on improving efficiency gains. We intend to continue to work with our customers and vendors to improve our operational efficiencies and enhance our profitability. We believe that improving our efficiencies will result in greater revenue and enhanced profitability as fixed costs are spread over a broader revenue base.
|
• |
Cross‑sell our complementary services. In addition to our hydraulic fracturing services, we offer a broad range of complementary services in support of our customers’ development activities, including cementing and coiled tubing. These complementary services create operational efficiencies for our customers, and allow us to capture a greater percentage of their capital spending across the lifecycle of an unconventional well. We believe that, if our customers increase spending levels, we are well positioned to continue cross‑selling and growing our complementary service offerings.
|
• |
Maintain financial stability and flexibility to pursue growth opportunities. Consistent with our historical practices, we plan to continue to maintain a conservative balance sheet, which will allow us to better react to potential changes in industry and market conditions and opportunistically grow our business. In the near term, we intend to continue our past practice of aligning our growth capital expenditures with visible customer demand by strategically deploying new equipment on a dedicated basis in response to inbound customer requests. We will also selectively evaluate potential strategic acquisitions that increase our scale and capabilities or diversify our operations.
|
Our Customers
Our customers consist primarily of oil and natural gas producers in North America. Our top five customers accounted for approximately 77.1%, 68.7% and 66.0% of our revenue, for the years ended December 31, 2019, 2018 and 2017, respectively. For the year ended December 31, 2019, Pioneer Natural Resources USA Inc. (“Pioneer”), XTO Energy Inc., CrownQuest Operating, LLC, accounted for 25.5%, 20.9%, and 13.2%, respectively, of total revenue. No other customer accounted for more than 10% of our total revenue for the year ended December 31, 2019.
Competition
The markets in which we operate are highly competitive. To be successful, an oilfield services company must provide services that meet the specific needs of oil and natural gas E&P companies at competitive prices. Competitive factors impacting sales of our services are price, reputation, technical expertise, service and equipment quality, and health and safety standards. Although we believe our customers consider all of these factors, we believe price is a key factor in E&P companies’ criteria in choosing a service provider. While we seek to price our services competitively, we believe many of our customers elect to work with us based on our deep local roots, operational expertise, equipment quality, ability to handle the most complex Permian Basin well completions and commitment to safety and reliability.
We provide our services primarily in the Permian Basin, and we compete against different companies in each service and product line we offer. Our competition includes many large and small oilfield service companies, including the largest integrated oilfield services companies. Our major competitors for hydraulic fracturing services include Nextier Oilfield Solutions Inc., Halliburton Company, Patterson‑UTI Energy Inc., RPC, Inc., Schlumberger Limited, Liberty Oilfield Services, FTS International, Inc., Superior Energy Services and a number of locally oriented businesses.
5
Seasonality
Our results of operations have historically reflected seasonal tendencies, generally in the fourth quarter, relating to the conclusion of our customers’ annual capital expenditure budgets, the holidays and inclement winter weather during which we may experience declines in our operating results.
Operating Risks and Insurance
Our operations are subject to hazards inherent in the oilfield services industry, such as accidents, blowouts, explosions, fires and spills and releases that can cause personal injury or loss of life, damage or destruction of property, equipment, natural resources and the environment and suspension of operations.
In addition, claims for loss of oil and natural gas production and damage to formations can occur in the oilfield services industry. If a serious accident were to occur at a location where our equipment and services are being used, it could result in us being named as a defendant in lawsuits asserting large claims.
Our business involves the transportation of heavy equipment and materials, and as a result, we may also experience traffic accidents which may result in spills, property damage and personal injury.
Despite our efforts to maintain safety standards, we have suffered accidents from time to time in the past and anticipate that we could experience accidents in the future. In addition to the property damage, personal injury and other losses from these accidents, the frequency and severity of these incidents affect our operating costs and insurability and our relationships with customers, employees, regulatory agencies and other parties. Any significant increase in the frequency or severity of these incidents, or the general level of compensation awards, could adversely affect the cost of, or our ability to obtain, workers’ compensation and other forms of insurance, and could have other material adverse effects on our financial condition and results of operations.
We maintain commercial general liability, workers’ compensation, business auto, commercial property, umbrella liability, excess liability, and directors and officers insurance policies providing coverages of risks and amounts that we believe to be customary in our industry. Further, we have pollution legal liability coverage for our business entities, which would cover, among other things, third party liability and costs of clean up relating to environmental contamination on our premises while our equipment is in transit and on our customers’ job site. With respect to our hydraulic fracturing operations, coverage would be available under our pollution legal liability policy for any surface or subsurface environmental clean‑up and liability to third parties arising from any surface or subsurface contamination. We also have certain specific coverages for some of our businesses, including our hydraulic fracturing services.
Although we maintain insurance coverage of types and amounts that we believe to be customary in the industry, we are not fully insured against all risks, either because insurance is not available or because of the high premium costs relative to perceived risk. Further, insurance rates have in the past been subject to wide fluctuation and changes in coverage could result in less coverage, increases in cost or higher deductibles and retentions. Liabilities for which we are not insured, or which exceed the policy limits of our applicable insurance, could have a material adverse effect on us. See “Risk Factors” for a description of certain risks associated with our insurance policies.
Environmental and Occupational Health and Safety Regulations
Our operations are subject to stringent laws and regulations governing the discharge of materials into the environment or otherwise relating to environmental protection, and occupational health and safety. Numerous federal, state and local governmental agencies issue regulations that often require difficult and costly compliance measures that could carry substantial administrative, civil and criminal penalties and may result in injunctive obligations for non-compliance. These laws and regulations may, for example, restrict the types, quantities and concentrations of various substances that can be released into the environment, limit or prohibit construction or drilling activities on certain lands lying within wilderness, wetlands, ecologically or seismically sensitive areas and other protected areas, or require action to prevent or remediate pollution from current or former operations. Moreover, it is not uncommon for neighboring landowners and other third parties to file claims for personal injury and property damage allegedly caused by the release of hazardous substances, hydrocarbons or other waste products into the environment. Changes in environmental, health and safety laws and regulations occur frequently, and any changes that result in more stringent and costly requirements could materially adversely affect our operations and financial position. We have not experienced any material adverse effect from compliance with these requirements, however, this trend may not continue in the future.
6
Below is an overview of some of the more significant environmental, health and safety requirements with which we must comply. Our customers’ operations are subject to similar laws and regulations. Any material adverse effect of these laws and regulations on our customers’ operations and financial position may also have an indirect material adverse effect on our operations and financial position.
Waste Handling. We handle, transport, store and dispose of wastes that are subject to the Resource Conservation and Recovery Act (“RCRA”) and comparable state laws and regulations, which affect our activities by imposing requirements regarding the generation, transportation, treatment, storage, disposal and cleanup of hazardous and non-hazardous wastes. With federal approval, the individual states administer some or all of the provisions of RCRA, sometimes in conjunction with their own, more stringent requirements. Although certain petroleum production wastes are exempt from regulation as hazardous wastes under RCRA, such wastes may constitute “solid wastes” that are subject to the less stringent requirements of non-hazardous waste provisions.
Administrative, civil and criminal penalties can be imposed for failure to comply with waste handling requirements. Moreover, the U.S. Environmental Protection Agency (“EPA”) or state or local governments may adopt more stringent requirements for the handling of non-hazardous wastes or recategorize some non-hazardous wastes as hazardous for future regulation. Indeed, legislation has been proposed from time to time in Congress to recategorize certain oil and natural gas exploration, development and production wastes as hazardous wastes. Several environmental organizations have also petitioned the EPA to modify existing regulations to recategorize certain oil and natural gas exploration, development and production wastes as hazardous. Any such changes in these laws and regulations could have a material adverse effect on our capital expenditures and operating expenses. Although we do not believe the current costs of managing our wastes, as presently classified, to be significant, any legislative or regulatory reclassification of oil and natural gas exploration and production wastes could increase our costs to manage and dispose of such wastes.
Remediation of Hazardous Substances. The Comprehensive Environmental Response, Compensation and Liability Act (“CERCLA” or “Superfund”) and analogous state laws generally impose liability without regard to fault or legality of the original conduct, on classes of persons who are considered to be responsible for the release of a hazardous substance into the environment. These persons include the current owner or operator of a contaminated facility, a former owner or operator of the facility at the time of contamination and those persons that disposed or arranged for the disposal of the hazardous substance at the facility. Liability for the costs of removing or remediating previously disposed wastes or contamination, damages to natural resources, the costs of conducting certain health studies, amongst other things, is strict and joint and several. In addition, it is not uncommon for neighboring landowners and other third parties to file claims for personal injury and property damage allegedly caused by the hazardous substances released into the environment. In the course of our operations, we use materials that, if released, would be subject to CERCLA and comparable state laws. Therefore, governmental agencies or third parties may seek to hold us responsible under CERCLA and comparable state statutes for all or part of the costs to clean up sites at which such hazardous substances have been released.
NORM. In the course of our operations, some of our equipment may be exposed to naturally occurring radioactive materials (“NORM”) associated with oil and gas deposits and, accordingly, may result in the generation of wastes and other materials containing NORM. NORM exhibiting levels of radiation in excess of established state standards are subject to special handling and disposal requirements, and any storage vessels, piping and work area affected by NORM may be subject to remediation or restoration requirements.
Water Discharges. The Clean Water Act, Safe Drinking Water Act, Oil Pollution Act and analogous state laws and regulations impose restrictions and strict controls regarding the unauthorized discharge of pollutants, including produced waters and other gas and oil wastes, into regulated waters. The discharge of pollutants into regulated waters is prohibited, except in accordance with the terms of a permit issued by the EPA or the state. Also, spill prevention, control and countermeasure plan requirements require appropriate containment berms and similar structures to help prevent the contamination of regulated waters.
Air Emissions. The Clean Air Act (“CAA”) and comparable state laws and regulations, regulate emissions of various air pollutants through the issuance of permits and the imposition of other emissions control requirements. The EPA has developed, and continues to develop, stringent regulations governing emissions of air pollutants from specified sources. New facilities may be required to obtain permits before work can begin, and existing facilities may be required to obtain additional permits and incur capital costs in order to remain in compliance. These and other laws and regulations may increase the costs of compliance for some facilities where we operate. Obtaining or renewing permits also has the potential to delay the development of oil and natural gas projects.
7
Climate Change. In the United States, no comprehensive climate change legislation has been implemented at the federal level. However, following the U.S. Supreme Court finding that greenhouse gases (“GHG”) emissions constitute a pollutant under the CAA, the EPA has adopted regulations that, among other things, establish construction and operating permit reviews for GHG emissions from certain large stationary sources, require the monitoring and annual reporting of GHG emissions from certain petroleum and natural gas system sources in the United States, and implement New Source Performance Standards directing the reduction of methane from certain new, modified, or reconstructed facilities in the oil and natural gas sector, and together with the Department of Transportation ("DOT"), implementing GHG emissions limits on vehicles manufactured for operation in the United States. For example, in June 2016, the EPA finalized rules that establish new air emission controls for methane emissions from certain new, modified, or reconstructed equipment and processes in the oil and natural gas source category, including production, processing, transmission, and storage activities, otherwise known as Subpart OOOOa. Following the change in administration, there have been attempts to modify these regulations, and litigation is ongoing.
Additionally, various states and groups of states have adopted or are considering adopting legislation, regulations or other regulatory initiatives that are focused on such areas GHG cap and trade programs, carbon taxes, reporting and tracking programs, and restriction of emissions. At the international level, there is an agreement, the United Nations-sponsored "Paris Agreement," for nations to limit their GHG emissions through non-binding, individually determined reduction goals every five years after 2020, although the United States has announced its withdrawal from such agreement, effective November 4, 2020.
Governmental, scientific, and public concern over the threat of climate change arising from GHG emissions has resulted in increasing political risks in the United States, including climate-change-related pledges made by some candidates seeking the office of the President of the United States in 2020. Some of these pledges have included calls to ban hydraulic fracturing, which could adversely impact our operations. Litigation risks are also increasing as a number of cities and other local governments have sought to bring suit against the largest oil and natural gas exploration and production companies in state or federal court, alleging among other things, that such companies created public nuisances by producing fuels that contributed to global warming effects, such as rising sea levels, and therefore are responsible for roadway and infrastructure damages as a result.
The adoption and implementation of new or more stringent international, federal or state legislation, regulations or other regulatory initiatives that impose more stringent standards for GHG emissions from the oil and natural gas sector or otherwise restrict the areas in which this sector may produce oil and natural gas or generate GHG emissions could result in increased costs of compliance or costs of consuming, and thereby reduce demand for, oil and natural gas, which could reduce demand for our services and products.
Moreover, climate change may cause more extreme weather conditions and increased volatility in seasonal temperatures. Extreme weather conditions can interfere with our operations and increase our costs, and damage resulting from extreme weather may not be fully insured.
Endangered and Threatened Species. Environmental laws such as the Endangered Species Act (“ESA”) and analogous state laws may impact exploration, development and production activities in areas where we operate. The ESA provides broad protection for species of fish, wildlife and plants that are listed as threatened or endangered. Similar protections are offered to migratory birds under the Migratory Bird Treaty Act and various state analogs. The U.S. Fish and Wildlife Service (“FWS”) may identify previously unidentified endangered or threatened species or may designate critical habitat and suitable habitat areas that it believes are necessary for survival of a threatened or endangered species. For example, the dunes sagebrush lizard, which is found only in the active and semi-stable shinnery oak dunes of southeastern New Mexico and adjacent portions of Texas (including areas where our customers operate), was a candidate species for listing under the ESA by the FWS for many years. As a result of a recent settlement with the environmental groups, the FWS has agreed to act on a petition to list the dunes sagebrush lizard by June 30, 2020, which would result in a formal one-year review to consider listing the species if the petition is accepted. To the extent any protections are implemented for this or any other species, it could cause us or our customers to incur additional costs or become subject to operating restrictions or operating bans in the affected areas.
Regulation of Hydraulic Fracturing and Related Activities. Our hydraulic fracturing operations are a significant component of our business. Hydraulic fracturing is an important and common practice that is used to stimulate production of hydrocarbons, particularly natural gas, from tight formations, including shales. The process, which involves the injection of water, sand and chemicals under pressure into formations to fracture the surrounding rock and stimulate production, is typically regulated by state oil and natural gas commissions. However, federal agencies have asserted regulatory authority over certain aspects of the process. For example, the EPA has previously issued a series of rules under
8
the CAA that establish new emission control requirements for certain oil and natural gas production and natural gas processing operations and associated equipment. There have been several attempts to modify or rescind such regulations and litigation is ongoing. Separately, the Bureau of Land Management (“BLM”) previously finalized a rule governing hydraulic fracturing on federal lands, but in June 2016, a federal district court judge in Wyoming struck down the final rule, finding that the BLM lacked congressional authority to promulgate the rule. While this ruling was initially challenged, in December 2017, the BLM published a rulemaking to rescind the final rule and reinstate the regulations that existed immediately before the published effective date of the rule. Further, legislation to amend the Safe Drinking Water Act to repeal the exemption for hydraulic fracturing (except when diesel fuels are used) from the definition of “underground injection” and require federal permitting and regulatory control of hydraulic fracturing, as well as legislative proposals to require disclosure of the chemical constituents of the fluids used in the fracturing process, have previously been proposed in Congress. Several states and local jurisdictions in which we or our customers operate also have adopted or are considering adopting regulations that could restrict or prohibit hydraulic fracturing in certain circumstances, impose more stringent operating standards and/or require the disclosure of the composition of hydraulic fracturing fluids.
Federal and state governments have also investigated whether the disposal of produced water into underground injection wells has caused increased seismic activity in certain areas. For example, the United States Geological Survey identified eight states with the most significant hazards from induced seismicity, including Oklahoma, Kansas, Texas, Colorado, New Mexico, Arkansas, Ohio and Alabama. In response to concerns regarding induced seismicity, regulators in some states have imposed, or are considering imposing, additional requirements in the permitting of produced water disposal wells or otherwise to assess any relationship between seismicity and the use of such wells. For example, Oklahoma has issued rules for wastewater disposal wells that impose permitting and operating restrictions and reporting requirements on disposal wells in proximity to faults and also, from time to time, has implemented plans directing certain wells where seismic incidents have occurred to restrict or suspend disposal well operations. In particular, the Oklahoma Corporation Commission’s well completion seismicity guidelines for operators in the SCOOP and STACK require hydraulic fracturing operations to be suspended following earthquakes of certain magnitudes in the vicinity. In addition, the Oklahoma Corporation Commission’s Oil and Gas Conservation Division has previously issued an order limiting future increases in the volume of oil and natural gas wastewater injected into the ground in an effort to reduce the number of earthquakes in the state. The Texas Railroad Commission has adopted similar rules. In addition, in December 2016, the EPA released its final report regarding the potential impacts of hydraulic fracturing on drinking water resources, concluding that “water cycle” activities associated with hydraulic fracturing may impact drinking water resources under certain limited circumstances. However, the EPA has imposed no regulatory limits as a result of this study.
Increased regulation of hydraulic fracturing and related activities (whether as a result of the EPA study results or resulting from other factors) could subject us and our customers to additional permitting and financial assurance requirements, more stringent construction specifications, increased monitoring, reporting and record keeping obligations, and plugging and abandonment requirements. New requirements could result in increased operational costs for us and our customers, and reduce the demand for our services.
OSHA Matters. The Occupational Safety and Health Act (“OSHA”) and comparable state statutes regulate the protection of the health and safety of workers. In addition, the OSHA hazard communication standard requires that information be maintained about hazardous materials used or produced in operations and that this information be provided to employees, state and local government authorities and the public.
Employees
As of December 31, 2019, we employed approximately 2,200 people. None of our employees are represented by labor unions or subject to collective bargaining agreements.
Primarily as a result of the significant decline in oil prices and our customers’ rapid response to reduce their drilling and completion activities, we have implemented significant reductions in our workforce since December 31, 2019. As of June 10, 2020, we had approximately 700 employees.
Availability of Filings
Our Annual Reports on Form 10-K, Quarterly Reports on Form 10-Q, Current Reports on Form 8-K and amendments to those reports filed or furnished pursuant to Section 13(a) or 15(d) of the Securities Exchange Act of 1934 (the “Exchange Act”), as amended, are made available free of charge on our internet web site at www.propetroservices.com, as soon as reasonably practicable after we have electronically filed the material with, or
9
furnished it to, the SEC. The SEC maintains an internet site that contains our reports, proxy and information statements and our other SEC filings. The address of that web site is www.sec.gov. Please note that information contained on our website, whether currently posted or posted in the future, is not a part of this Annual Report or the documents incorporated by reference in this Annual Report.
10
Item 1A. Risk Factors.
The following is a description of significant factors that could cause actual results to differ materially from those contained in forward-looking statement made in this Annual Report and presented elsewhere by management from time to time. Such factors may have a material adverse effect on our business, financial condition and results of operations. It is not possible to predict or identify all such factors. Consequently, you should not consider any such list to be a complete statement of all our potential risks or uncertainties. Due to these, and other factors, past performance should not be considered an indication of future performance.
Our business and financial performance depends on the oil and natural gas industry and particularly on the level of capital spending and exploration and production activity within the United States and in the Permian Basin, and a decline in prices for oil and natural gas has had and may continue to have an adverse effect on our revenue, cash flows, profitability and growth.
Demand for most of our services depends substantially on the level of capital expenditures in the Permian Basin by companies in the oil and natural gas industry. As a result, our operations are dependent on the levels of capital spending and activity in oil and gas exploration, development and production. Prolonged low oil and gas prices would generally depress the level of oil and natural gas exploration, development, production, and well completion activity and would result in a corresponding decline in the demand for the hydraulic fracturing services that we provide. For many years, oil prices and markets have been extremely volatile. Prices are affected by many factors beyond our control. West Texas Intermediate (“WTI”) oil prices declined significantly in 2015 and 2016 to approximately $30 per barrel, but subsequently recovered in 2017 and 2018. However, in 2019, oil and natural gas prices were highly volatile. The average WTI oil prices per barrel was approximately $57, $65 and $51 for the years ended December 31, 2019, 2018 and 2017, respectively. Demand for our services is largely dependent on oil and natural gas prices, and our customers’ completion budgets and rig count. In March 2020, WTI oil prices declined significantly, to a low of approximately $20 per barrel towards the end of March 2020. On June 17, 2020 the WTI oil price was approximately $38 per barrel. The decline in and unpredictable nature of oil and natural gas prices have caused a reduction in our customers’ spending and associated drilling and completion activities, which has had and may continue to have an adverse effect on our revenue and cash flows. We are also experiencing pricing pressure on our services from substantially all of our customers which has decreased margins for us. If prices continue to decline or remain low and are highly unpredictable, additional declines in our customers’ spending would have a further adverse effect on our revenue, margins and cash flows. In addition, a worsening of these conditions may result in a material adverse impact on certain of our customers’ liquidity and financial position resulting in further spending reductions, delays in the collection of amounts owed to us and similar impacts.
Many factors over which we have no control affect the supply of, and demand for our services, and our customers’ willingness to explore, develop and produce oil and natural gas, and therefore, influence prices for our services, including:
• |
the severity and duration of world health events, including the recent COVID-19 pandemic, related economic repercussions and the resulting severe disruption in the oil and gas industry and negative impact on demand for oil and gas, which is negatively impacting our business; |
• |
the current significant surplus in the supply of oil and actions by the members of OPEC+ with respect to oil production levels and announcements of potential changes in such levels, including the ability of the OPEC+ countries to agree on and comply with supply limitations; |
• |
uncertainty regarding the timing, pace and extent of an economic recovery in the United States and elsewhere, which in turn will likely affect demand for crude oil and natural gas and therefore the demand for our services; |
• |
the domestic and foreign supply of, and demand for, oil and natural gas; |
• |
the level of prices, and expectations about future prices, of oil and natural gas; |
• |
the level of global oil and natural gas exploration and production; |
• |
the cost of exploring for, developing, producing and delivering oil and natural gas; |
• |
the supply of and demand for drilling and hydraulic fracturing equipment; |
• |
the expected decline rates of current production; |
11
• |
the price and quantity of foreign imports; |
• |
political and economic conditions in oil and natural gas producing countries and regions, including the United States, the Middle East, Africa, South America and Russia; |
• |
operational challenges relating to the COVID-19 pandemic and efforts to mitigate the spread of the virus, including logistical challenges, protecting the health and well-being of our employees, remote work arrangements, performance of contracts and supply chain disruptions; |
• |
speculative trading in crude oil and natural gas derivative contracts; |
• |
the level of consumer product demand; |
• |
the discovery rates of new oil and natural gas reserves; |
• |
contractions in the credit market; |
• |
the strength or weakness of the U.S. dollar; |
• |
available pipeline and other transportation capacity; |
• |
the levels of oil and natural gas storage; |
• |
weather conditions and other natural disasters; |
• |
domestic and foreign tax policy; |
• |
domestic and foreign governmental approvals and regulatory requirements and conditions; |
• |
the continued threat of terrorism and the impact of military and other action, including military action in the Middle East; |
• |
political or civil unrest in the United States or elsewhere; |
• |
technical advances affecting energy consumption; |
• |
the proximity and capacity of oil and natural gas pipelines and other transportation facilities; |
• |
the price and availability of alternative fuels; |
• |
the ability of oil and natural gas producers to raise equity capital and debt financing; |
• |
merger and divestiture activity among oil and natural gas producers; and |
• |
overall domestic and global economic conditions. |
These factors and the volatility of the energy markets make it extremely difficult to predict future oil and natural gas price movements with any certainty. For example, in March 2020, Saudi Arabia and Russia failed to agree on a plan to cut production of oil and gas within OPEC and Russia. Subsequently, Saudi Arabia announced plans to increase production and reduce the prices at which they sell oil. These events, combined with the continued outbreak of COVID-19 that has reduced economic activity and disrupted the supply chain of certain of our customers, have contributed to a sharp drop in prices for oil in the first quarter of 2020, continuing into the second quarter. Regulatory action to curtail production has been contemplated; for example, the Texas Railroad Commission, which regulates the production of oil and gas in the state of Texas, held a hearing in April 2020 regarding potential production cuts for producers in Texas in light of the recent decline in oil prices globally. The Railroad Commission ultimately declined to institute mandatory production cuts, but the agency may choose to revisit the issue if market weakness persists, which could further reduce demand for our services. While an agreement to cut production was reached in April 2020, oil prices have remained low, and global oil demand is expected to remain challenged at least until the COVID-19 outbreak can be contained. The impacts of these price declines have had, and may continue to have, a material adverse effect on our business, results of operation and financial condition.
12
The cyclical nature of the oil and natural gas industry may cause our operating results to fluctuate.
We derive our revenues from companies in the oil and natural gas exploration and production industry, a historically cyclical industry with levels of activity that are significantly affected by the levels and volatility of oil and natural gas prices. We have experienced, and may in the future experience, significant fluctuations in operating results as a result of the reactions of our customers to changes in oil and natural gas prices. For example, the decline in and unpredictable nature of oil and gas prices in 2019 and early 2020, combined with adverse changes in the capital and credit markets and the COVID-19 outbreak in early 2020, caused many exploration and production companies to reduce their capital budgets and drilling activity. This has resulted in a significant decline in demand for oilfield services and adversely impacted the prices oilfield services companies can charge for their services. These factors have materially and adversely affected our business, results of operations and financial condition. In addition, a majority of the service revenue we earn is based upon a charge for a relatively short period of time (for example, a day, a week or a month) for the actual period of time the service is provided to our customers. By contracting services on a short‑term basis, we are exposed to the risks of a rapid reduction in market prices and utilization and resulting volatility in our revenues.
Events outside of our control, including an epidemic or outbreak of an infectious disease, such as COVID-19, may materially adversely affect our business.
We face risks related to epidemics, outbreaks or other public health events that are outside of our control, and could significantly disrupt our operations and adversely affect our financial condition. The global or national outbreak of an illness or any other communicable disease, or any other public health crisis, such as COVID-19, may cause disruptions to our business and operational plans, which may include (i) shortages of employees, (ii) unavailability of contractors and subcontractors, (iii) interruption of supplies from third parties upon which we rely, (iv) recommendations of, or restrictions imposed by, government and health authorities, including quarantines, to address the COVID-19 outbreak and (v) restrictions that we and our contractors, subcontractors and our customers impose, including facility shutdowns, to ensure the safety of employees. For example, in response to COVID-19, we have reduced headcount, officer salaries and director compensation, closed yard locations, reduced third party expenses and streamlined operations, reduced capital expenditures and recorded impairment expenses.
The COVID-19 pandemic has spread across the globe and impacted financial markets and worldwide economic activity and adversely affected our operations. In addition, the effects of COVID-19 and concerns regarding its global spread have negatively impacted the domestic and international demand for crude oil and natural gas, which has contributed to price volatility, impacted the operations and activity levels of our customers and materially and adversely affected the demand for oilfield services. These factors may also negatively impact our current suppliers and their ability or willingness to provide the necessary equipment, parts or raw materials, and they may otherwise fail to deliver the products timely and in the quantities required. Any resulting delays in the provision of our services could have a material adverse effect on our business, financial condition, results of operations and cash flows. As the potential impact from COVID-19 is difficult to predict, the extent to which it may negatively affect our operating results or the duration of any potential business disruption is uncertain. Any potential impact will depend on future developments and new information that may emerge regarding the severity and duration of COVID-19 and the actions taken by authorities to contain it or treat its impact, all of which are beyond our control. These potential impacts, while uncertain, could adversely affect our business, results of operations and financial condition.
Our business may be adversely affected by a deterioration in general economic conditions or a weakening of the broader energy industry.
A prolonged economic slowdown or recession in the United States, adverse events relating to the energy industry or regional, national and global economic conditions and factors, particularly a further slowdown in the exploration and production industry, could negatively impact our operations and therefore adversely affect our results. The risks associated with our business are more acute during periods of economic slowdown or recession because such periods may be accompanied by decreased exploration and development spending by our customers, decreased demand for oil and natural gas and decreased prices for oil and natural gas. The COVID-19 pandemic and the recent turmoil between the members of OPEC+ have caused oil prices to fall substantially and have impacted the global economy; such factors have heightened the risk of a prolonged economic slowdown or recession in the United States.
The majority of our operations are located in the Permian Basin, making us vulnerable to risks associated with operating in one major geographic area.
Our operations are geographically concentrated in the Permian Basin. For the years ended December 31, 2019, 2018 and 2017, approximately 99.4%, 99.0% and 97.0%, respectively, of our revenues were attributable to our operations
13
in the Permian Basin. As a result of this concentration, we may be disproportionately exposed to the impact of regional supply and demand factors, delays or interruptions of production from wells in the Permian Basin caused by significant governmental regulation, processing or transportation capacity constraints, market limitations, curtailment of production or interruption of the processing or transportation of oil and natural gas produced from the wells in these areas. In addition, the effect of fluctuations on supply and demand may become more pronounced within specific geographic oil and natural gas producing areas such as the Permian Basin, which may cause these conditions to occur with greater frequency or magnify the effects of these conditions. Due to the concentrated nature of our operations, we could experience any of the same conditions at the same time, resulting in a relatively greater impact on our revenue than they might have on other companies that have more geographically diverse operations.
We are exposed to the credit risk of our customers, and any material nonpayment or nonperformance by our customers could adversely affect our business, results of operations and financial condition.
We are subject to the risk of loss resulting from nonpayment or nonperformance by our customers. Our credit procedures and policies may not be adequate to fully eliminate customer credit risk. If we fail to adequately assess the creditworthiness of existing or future customers or unanticipated deterioration in their creditworthiness, any resulting increase in nonpayment or nonperformance by them and our inability to re‑market or otherwise use the production could have a material adverse effect on our business, results of operations and financial condition. In weak economic environments, we may experience increased delays and failures to pay due to, among other reasons, a reduction in our customers’ cash flow from operations and their access to the credit markets or other sources of capital. The decline in and unpredictable nature of oil and gas prices in 2019 and 2020 has negatively impacted the financial condition and liquidity of our customers, and future declines, sustained lower prices, or continued volatility could impact their ability to meet their financial obligations to us. If our customers delay paying or fail to pay us a significant amount of our outstanding receivables, it could have a material adverse effect on our liquidity, results of operations, and financial condition.
We face significant competition that may cause us to lose market share, and competition in our industry has intensified during the industry downturn.
The oilfield services industry is highly competitive and has relatively few barriers to entry. The principal competitive factors impacting sales of our services are price, reputation and technical expertise, equipment and service quality and health and safety standards. The market is also fragmented and includes numerous small companies capable of competing effectively in our markets on a local basis, as well as several large companies that possess substantially greater financial and other resources than we do. Our larger competitors’ greater resources could allow those competitors to compete more effectively than we can. For instance, our larger competitors may offer services at below‑market prices or bundle ancillary services at no additional cost to our customers. We compete with large national and multi‑national companies that have longer operating histories, greater financial, technical and other resources and greater name recognition than we do. Several of our competitors provide a broader array of services and have a stronger presence in more geographic markets. In addition, we compete with several smaller companies capable of competing effectively on a regional or local basis.
Some jobs are awarded on a bid basis, which further increases competition based on price. Pricing is often the primary factor in determining which qualified contractor is awarded a job. The competitive environment may be further intensified by mergers and acquisitions among oil and natural gas companies or other events that have the effect of reducing the number of available customers. As a result of competition, we may lose market share or be unable to maintain or increase prices for our present services or to acquire additional business opportunities, which could have a material adverse effect on our business, financial condition, results of operations and cash flows.
Our competitors may be able to respond more quickly to new or emerging technologies and services and changes in customer requirements. The amount of equipment available may exceed demand, which could result in active price competition. In addition, some exploration and production companies have commenced completing their wells using their own hydraulic fracturing equipment and personnel. Any increase in the development and utilization of in‑house fracturing capabilities by our customers could decrease the demand for our services and have a material adverse impact on our business.
Pressure on pricing for our services resulting from the industry downturn has impacted, and may continue to impact, our ability to maintain utilization and pricing for our services or implement price increases. During periods of declining pricing for our services, we may not be able to reduce our costs accordingly, which could further adversely affect our results of operations. Also, we may not be able to successfully increase prices without adversely affecting our utilization levels. The inability to maintain our utilization and pricing levels, or to increase our prices as costs increase, could have a material adverse effect on our business, financial condition and results of operations.
14
Furthermore, competition among oilfield service and equipment providers is affected by each provider’s reputation for safety and quality. We cannot assure that we will be able to maintain our competitive position.
New technology may cause us to become less competitive.
The oilfield services industry is subject to the introduction of new drilling and completion techniques and services using new technologies, some of which may be subject to patent or other intellectual property protections. As competitors and others use or develop new or comparable technologies in the future, we may lose market share or be placed at a competitive disadvantage. Further, we may face competitive pressure to develop, implement or acquire and deploy certain technology improvements at a substantial cost, such as our new DuraStim® fleets or the cost of implementing or purchasing a technology like the new DuraStim® fleets may be substantially higher than anticipated, and we may not be able to successfully implement the DuraStim® fleets or other technologies we may purchase. Some of our competitors have greater financial, technical and personnel resources that may allow them to enjoy technological advantages and develop and implement new products on a timely basis or at an acceptable cost. We cannot be certain that we will be able to develop and implement new technologies or products on a timely basis or at an acceptable cost. Limits on our ability to develop, effectively use and implement new and emerging technologies could have a material adverse effect on our business, financial condition, prospects or results of operations.
Our business depends upon our ability to obtain specialized equipment, parts and key raw materials, including frac sand and chemicals, from third‑party suppliers, and we may be vulnerable to delayed deliveries and future price increases.
We purchase specialized equipment, parts and raw materials (including, for example, frac sand, chemicals and fluid ends) from third party suppliers and affiliates. At times during the business cycle, there is a high demand for hydraulic fracturing and other oilfield services and extended lead times to obtain equipment and raw materials needed to provide these services. Should our current suppliers be unable or unwilling to provide the necessary equipment, parts or raw materials or otherwise fail to deliver the products timely and in the quantities required, any resulting delays in the provision of our services could have a material adverse effect on our business, financial condition, results of operations and cash flows. In addition, future price increases for this type of equipment, parts and raw materials could negatively impact our ability to purchase new equipment, to update or expand our existing fleets, to timely repair equipment in our existing fleets or meet the current demands of our customers. In addition, the COVID-19 pandemic may have a negative impact on our suppliers’ ability or willingness to provide necessary equipment, parts or raw materials, and they may otherwise fail to deliver the products timely and in the quantities required.
We may be required to pay fees to certain of our sand suppliers based on minimum volumes under long-term contracts regardless of actual volumes received.
We enter into purchase agreements with our sand suppliers (the “Sand suppliers”) to secure supply of sand as part of its normal course of business. The agreements with the Sand suppliers require that we purchase a minimum volume of sand, constituting substantially all of its sand requirements, from the Sand suppliers, otherwise certain penalties may be charged. Under certain of the purchase agreements, a shortfall fee applies if we purchase less than the minimum volume of sand. The shortfall fee represents liquidated damages and is either a fixed percentage of the purchase price for the minimum volumes or a fixed price per ton of unpurchased volumes. Under one of the purchase agreements, we are obligated to purchase a specified percentage of our overall sand requirements, or we must pay the supplier the difference between the purchase price of the minimum volumes under the purchase agreement and the purchase price of the volumes actually purchased. Our minimum volume commitments under the purchase agreements are either based on a percentage of our total usage or fixed minimum quantity. Our agreements with the Sand suppliers expire at different times prior to April 30, 2022.
If the activity level of our customers declines and the demand for our services is materially and adversely affected, we may be required to pay for more sand from our Sand suppliers than we need in the performance of our services, regardless of whether we take physical delivery of such sand. In such an event, we may be required to pay shortfall fees or other penalties under the purchase agreements, which could have a material adverse effect on our business, financial condition, or results of operations. The decrease in our customers’ activity resulting from the COVID-19 pandemic and recent turmoil between the members of OPEC+, among other factors, has heightened the risk that we may be required to pay shortfall fees or other penalties to the Sand suppliers in the future.
15
Reliance upon a few large customers may adversely affect our revenue and operating results.
The majority of our revenue is generated from our hydraulic fracturing services. Due to the large percentage of our revenue historically derived from our hydraulic fracturing services with recurring customers and the limited availability of our fracturing units, we have had some degree of customer concentration. Our top ten customers represented approximately 95.5%, 85.5% and 87.0% of our consolidated revenue for the years ended December 31, 2019, 2018 and 2017, respectively. It is likely that we will depend on a relatively small number of customers for a significant portion of our revenue in the future. If a major customer fails to pay us, revenue would be impacted and our operating results and financial condition could be harmed. Additionally, if we were to lose any material customer, we may not be able to redeploy our equipment at similar utilization or pricing levels and such loss could have an adverse effect on our business until the equipment is redeployed at similar utilization or pricing levels.
Certain of our completion services, particularly our hydraulic fracturing services, are substantially dependent on the availability of water. Restrictions on our or our customers’ ability to obtain water may have an adverse effect on our financial condition, results of operations and cash flows.
Water is an essential component of unconventional shale oil and natural gas production during both the drilling and hydraulic fracturing processes. Over the past several years, certain of the areas in which we and our customers operate have experienced extreme drought conditions and competition for water in such areas is growing. In addition, some state and local governmental authorities have begun to monitor or restrict the use of water subject to their jurisdiction for hydraulic fracturing to ensure adequate local water supply. For instance, some states require E&P companies to report certain information regarding the water they use for hydraulic fracturing and to monitor the quality of groundwater surrounding some wells stimulated by hydraulic fracturing. Generally, our water requirements are met by our customers from sources on or near their sites, but there is no assurance that our customers will be able to obtain a sufficient supply of water from sources in these areas. Our or our customers’ inability to obtain water from local sources or to effectively utilize flowback water could have an adverse effect on our financial condition, results of operations and cash flows.
We rely on a few key employees whose absence or loss could adversely affect our business.
Many key responsibilities within our business have been assigned to a small number of employees. The loss of their services could adversely affect our business. In particular, the loss of the services of one or more members of our executive team, such as our Chief Executive Officer, Chief Operating Officer, Senior Vice President of Operations, Chief Financial Officer, Chief Strategy and Administrative Officer, Chief Accounting Officer and General Counsel could disrupt our operations. We do not maintain “key person” life insurance policies on any of our employees. As a result, we are not insured against any losses resulting from the death of our key employees.
If we are unable to employ a sufficient number of skilled and qualified workers, our capacity and profitability could be diminished and our growth potential could be impaired.
The delivery of our services requires skilled and qualified workers with specialized skills and experience who can perform physically demanding work. As a result of the volatility of the oilfield services industry and the demanding nature of the work, workers may choose to pursue employment in fields that offer a more desirable work environment at wage rates that are competitive. Our ability to be productive and profitable will depend upon our ability to employ and retain skilled workers. In addition, our ability to expand our operations depends in part on our ability to increase the size of our skilled labor force. As a result of the downturn in the oil and gas industry resulting from the COVID-19 pandemic and recent turmoil between the members of OPEC+, among other factors, we have made reductions in the size of workforce due to reduced demand for our services. If demand for our services increases, we may experience difficulty in hiring or re-hiring skilled and unskilled workers in the future to meet that demand. At times, the demand for skilled workers in our geographic areas of operations is high, and the supply is limited. As a result, competition for experienced oilfield service personnel is intense, and we face significant challenges in competing for crews and management with large and well‑established competitors. A significant increase in the wages paid by competing employers could result in a reduction of our skilled labor force, increases in the wage rates that we must pay, or both. Furthermore, a significant decrease in the wages paid by us or our competitors as a result of reduced industry demand could result in a reduction of the available skilled labor force, and there is no assurance that the availability of skilled labor will improve following a subsequent increase in demand for our services or an increase in wages. If either of these events were to occur, our capacity and profitability could be diminished and our growth potential could be impaired.
16
Our operations require substantial capital and we may be unable to obtain needed capital or financing on satisfactory terms, or at all, which could limit our ability to grow.
The oilfield services industry is capital intensive. In conducting our business and operations, we have made, and expect to continue to make, substantial capital expenditures. Our total capital expenditures incurred were approximately $400.7 million, $592.6 million and $305.3 million during the years ended December 31, 2019, 2018 and 2017. We have historically financed capital expenditures primarily with funding from cash on hand, cash flow from operations, equipment and vendor financing and borrowings under our credit facility. We may be unable to generate sufficient cash from operations and other capital resources to maintain planned or future levels of capital expenditures which, among other things, may prevent us from acquiring new equipment or properly maintaining our existing equipment. With the current depressed oil and gas market conditions, our remaining availability under our ABL Credit Facility will be adversely impacted by the expected decline in our customers’ activity and we may be unable to borrow under our ABL Credit Facility if our eligible accounts receivable continues to decline. Further, any disruptions or continuing volatility in the global financial markets may lead to an increase in interest rates or a contraction in credit availability impacting our ability to finance our operations. For example, our borrowing base declined from $181.2 million as of December 31, 2019 to approximately $16.8 million as of June 19, 2020 due to decreased activity levels and the resulting decrease to our eligible accounts receivable. Based on current and expected market conditions and customer activity levels, we expect our borrowing base to materially decline further in the near term. This could put us at a competitive disadvantage or interfere with our growth plans. Further, our actual capital expenditures could exceed our capital expenditure budget. In the event our capital expenditure requirements at any time are greater than the amount we have available, we could be required to seek additional sources of capital, which may include debt financing, joint venture partnerships, sales of assets, offerings of debt or equity securities or other means. We may not be able to obtain any such alternative source of capital. We may be required to curtail or eliminate contemplated activities. If we can obtain alternative sources of capital, the terms of such alternative may not be favorable to us. In particular, the terms of any debt financing may include covenants that significantly restrict our operations. Our inability to grow as planned may reduce our chances of maintaining and improving profitability.
Concerns over general economic, business or industry conditions may have a material adverse effect on our results of operations, liquidity and financial condition.
Concerns over global economic conditions, geopolitical issues, public health crises (including the COVID-19 pandemic), interest rates, inflation, the availability and cost of credit and the United States and foreign financial markets have contributed to increased economic uncertainty and diminished expectations for the global economy. These factors, combined with volatility in commodity prices, business and consumer confidence and unemployment rates, have precipitated an economic slowdown. Concerns about global economic growth have had a significant adverse impact on global financial markets and commodity prices, including the significant decline in WTI oil prices beginning February 2020. The decline in and unpredictable nature of oil and natural gas prices have caused a reduction in our customers’ spending and associated drilling and completion activities, which had and may continue to have an adverse effect on our revenue and cash flows. If the current economic climate in the United States or abroad continues, deteriorates further or remains uncertain, worldwide demand for petroleum products could diminish further, which could impact the price at which oil, natural gas and natural gas liquids can be sold, which could affect the ability of our customers to continue operations and adversely impact our results of operations, liquidity and financial condition.
Our indebtedness and liquidity needs could restrict our operations and make us more vulnerable to adverse economic conditions.
Our existing and future indebtedness, whether incurred in connection with acquisitions, operations or otherwise, may adversely affect our operations and limit our growth, and we may have difficulty making debt service payments on such indebtedness as payments become due. Our level of indebtedness may affect our operations in several ways, including the following:
• |
increasing our vulnerability to general adverse economic and industry conditions; |
• |
the covenants that are contained in the agreements governing our indebtedness could limit our ability to borrow funds, dispose of assets, pay dividends and make certain investments; |
• |
our debt covenants could also affect our flexibility in planning for, and reacting to, changes in the economy and in our industry; |
17
• |
any failure to comply with the financial or other debt covenants, including covenants that impose requirements to maintain certain financial ratios, could result in an event of default, which could result in some or all of our indebtedness becoming immediately due and payable; |
• |
our level of debt could impair our ability to obtain additional financing, or obtain additional financing on favorable terms, in the future for working capital, capital expenditures, acquisitions or other general corporate purposes; and |
• |
our business may not generate sufficient cash flow from operations to enable us to meet our obligations under our indebtedness. |
Restrictions in our ABL Credit Facility (as defined herein) and any future financing agreements may limit our ability to finance future operations or capital needs or capitalize on potential acquisitions and other business opportunities.
The operating and financial restrictions and covenants in our credit facility and any future financing agreements could restrict our ability to finance future operations or capital needs or to expand or pursue our business activities. For example, our ABL Credit Facility restricts or limits our ability to:
• |
grant liens; |
• |
incur additional indebtedness; |
• |
engage in a merger, consolidation or dissolution; |
• |
enter into transactions with affiliates; |
• |
sell or otherwise dispose of assets, businesses and operations; |
• |
materially alter the character of our business as currently conducted; and |
• |
make acquisitions, investments and capital expenditures. |
Furthermore, our ABL Credit Facility contains certain other operating and financial covenants. Our ability to comply with the covenants and restrictions contained in the ABL Credit Facility may be affected by events beyond our control, including prevailing economic, financial and industry conditions. If market or other economic conditions deteriorate, our ability to comply with these covenants may be impaired. If we violate any of the restrictions, covenants, ratios or tests in our ABL Credit Facility, a significant portion of our indebtedness may become immediately due and payable and our lenders’ commitment to make further loans to us may terminate. Further, our borrowing base, as redetermined monthly, is tied to 85.0% of eligible accounts receivable. Changes to our operational activity levels have an impact on our total eligible accounts receivable, which could result in significant changes to our borrowing base and therefore our availability under our ABL Credit Facility. For example, our borrowing base declined from $181.2 million as of December 31, 2019 to approximately $16.8 million as of June 19, 2020 due to decreased activity levels and the resulting decrease to our eligible accounts receivable. Based on current and expected market conditions and customer activity levels, we expect our borrowing base to materially decline further in the near term. If our borrowing base is reduced below the amount of our outstanding borrowings, we will be required to repay the excess borrowings immediately on demand by the lenders. We might not have, or be able to obtain, sufficient funds to make these accelerated payments. Any subsequent replacement of our ABL Credit Facility or any new indebtedness could have similar or greater restrictions. Please read “Management’s Discussion and Analysis of Financial Condition and Results of Operations — Liquidity and Capital Resources — Credit Facility and Other Financing Arrangements.”
We may become more leveraged and our indebtedness could adversely affect our operations and financial condition.
Our business is capital intensive and we may seek to raise debt capital to fund our business and growth strategy. Indebtedness could have negative consequences that could materially and adversely affect our business, financial condition, results of operations, cash flows and prospects, such as:
• |
requiring us to dedicate a substantial portion of our cash flow from operating activities to payments on our indebtedness, thereby reducing the availability of cash flow to fund working capital, capital expenditures, research and development efforts, potential strategic acquisitions and other general corporate purposes; |
18
• |
limiting our ability to obtain additional financing to fund growth, working capital or capital expenditures, or to fulfill debt service requirements or other cash requirements; |
• |
increasing our vulnerability to economic downturns and changing market conditions; and |
• |
placing us at a competitive disadvantage relative to competitors that have less debt. |
Furthermore, interest rates on future indebtedness could be higher than current levels, causing our financing costs to increase accordingly. In addition, LIBOR and other “benchmark” rates are subject to ongoing national and international regulatory scrutiny and reform. In July 2017, the United Kingdom’s Financial Conduct Authority, which regulates LIBOR, announced that it intends to phase out LIBOR by the end of 2021. At this time, no consensus exists as to what rate or rates may become acceptable alternatives to LIBOR and we are unable to predict the effect of any such alternatives on our business and results of operations. However, if LIBOR is phased out without a replacement benchmark, our only option under the ABL Credit Facility will be to borrow at the Base Rate (as defined in the ABL Credit Facility) until an alternative benchmark rate is selected. Changes in interest rates, either positive or negative, may affect the yield requirements of investors who invest in our shares, and a rising interest rate environment could have an adverse impact on the price of our shares, our ability to issue equity or incur debt.
We may record losses or impairment charges related to goodwill and long-lived assets.
Changes in future market conditions and prolonged periods of low utilization, changes in technology or the sale of assets below their carrying value may cause us to experience losses in our results of operations. These events could result in the recognition of impairment charges or losses from asset sales that negatively impact our financial results. Significant impairment charges or losses from asset sales as a result of a decline in market conditions or otherwise could have a material adverse effect on our results of operations in future periods. For example, in 2019, we recorded an impairment charge related to our drilling and flowback assets of $3.4 million. If the depressed oil and natural gas prices continue to trade at depressed price levels as experienced in the beginning of March 2020, and our equipment remains idle or under-utilized, the estimated fair value of such equipment may decline, which will result in additional impairment expense in the future.
During the first quarter of 2020, management determined the reductions in commodity prices driven by the potential impact of the novel COVID-19 virus and global supply and demand dynamics coupled with the sustained decrease in the Company’s share price were triggering events for goodwill and asset impairment. As a result of the triggering events, we performed an interim goodwill impairment test on the hydraulic fracturing reporting unit and a recoverability tests on each of the assets groups. As a result, we expect to recognize impairments and charges in the first quarter of 2020 as follows:
• |
goodwill impairment of approximately $9.4 million; |
• |
drilling asset group impairment of approximately $1.1 million as a result of our recoverability tests; and |
• |
write-off of $6.1 million of deposits related to options to purchase additional DuraStim® equipment for which options expire at various times through the end of April 2021 as it is not probable we would exercise our options due to the events described above.
|
If the depressed oil prices and the current economic conditions continue for a longer period of time, actual results may differ from estimates and future assumptions may change resulting in additional impairment charges in the future.
Our operations are subject to unforeseen interruptions and hazards inherent in the oil and natural gas industry, for which we may not be adequately insured and which could cause us to lose customers and substantial revenue.
Our operations are exposed to the risks inherent to our industry, such as equipment defects, vehicle accidents, worksite injuries to our or third-party personnel, fires, explosions, blowouts, surface cratering, uncontrollable flows of gas or well fluids, pipe or pipeline failures, abnormally pressured formations and various environmental hazards, such as oil spills and releases of, and exposure to, hazardous substances. For example, our operations are subject to risks associated with hydraulic fracturing, including any mishandling, surface spillage or potential underground migration of fracturing fluids, including chemical additives. In addition, our operations are exposed to potential natural disasters, including blizzards, tornadoes, storms, floods, other adverse weather conditions and earthquakes. The occurrence of any of these events could result in substantial losses to us due to injury or loss of life, severe damage to or destruction of property, natural resources and equipment, pollution or other environmental damage, clean‑up responsibilities, regulatory investigations and penalties or other damage resulting in curtailment or suspension of our operations or the loss of
19
customers. The cost of managing such risks may be significant. The frequency and severity of such incidents will affect operating costs, insurability and relationships with customers, employees and regulators. In particular, our customers may elect not to purchase our services if they view our environmental or safety record as unacceptable, which could cause us to lose customers and substantial revenues.
Our insurance may not be adequate to cover all losses or liabilities we may suffer. Furthermore, we may be unable to maintain or obtain insurance of the type and amount we desire at reasonable rates. As a result of market conditions, premiums and deductibles for certain of our insurance policies have increased and could escalate further. In addition, sub‑limits have been imposed for certain risks. In some instances, certain insurance could become unavailable or available only for reduced amounts of coverage. If we were to incur a significant liability for which we are not fully insured, it could have a material adverse effect on our business, results of operations and financial condition. In addition, we may not be able to secure additional insurance or bonding that might be required by new governmental regulations. This may cause us to restrict our operations, which might severely impact our financial position.
Since hydraulic fracturing activities are part of our operations, they are covered by our insurance against claims made for bodily injury, property damage and clean‑up costs stemming from a sudden and accidental pollution event. However, we may not have coverage if we are unaware of the pollution event and unable to report the “occurrence” to our insurance company within the time frame required under our insurance policy. In addition, these policies do not provide coverage for all liabilities, and the insurance coverage may not be adequate to cover claims that may arise, or we may not be able to maintain adequate insurance at rates we consider reasonable. A loss not fully covered by insurance could have a material adverse effect on our financial position, results of operations and cash flows.
A terrorist attack, armed conflict or political or civil unrest could harm our business.
Terrorist activities, anti‑terrorist efforts, other armed conflicts and political or civil unrest could adversely affect the U.S. and global economies and could prevent us from meeting financial and other obligations. We could experience loss of business, delays or defaults in payments from payors or disruptions of fuel supplies and markets if pipelines, production facilities, processing plants, refineries or transportation facilities are direct targets or indirect casualties of an act of terror or war. Such activities could reduce the overall demand for oil and natural gas, which, in turn, could also reduce the demand for our services. Terrorist activities, the threat of potential terrorist activities, political or civil unrest and any resulting economic downturn could adversely affect our results of operations, impair our ability to raise capital or otherwise adversely impact our ability to realize certain business strategies.
Increasing trucking regulations may increase our costs and negatively impact our results of operations.
In connection with our business operations, including the transportation and relocation of our hydraulic fracturing equipment and shipment of frac sand, we operate trucks and other heavy equipment. As such, we operate as a motor carrier in providing certain of our services and therefore are subject to regulation by the DOT and by various state agencies. These regulatory authorities exercise broad powers, governing activities such as the authorization to engage in motor carrier operations, driver licensing, insurance requirements, financial reporting and review of certain mergers, consolidations and acquisitions, and transportation of hazardous materials. Our trucking operations are subject to possible regulatory and legislative changes that may increase our costs. Some of these possible changes include increasingly stringent environmental regulations, changes in the hours of service regulations which govern the amount of time a driver may drive or work in any specific period, onboard black box recorder device requirements or limits on vehicle weight and size.
Interstate motor carrier operations are subject to safety requirements prescribed by the DOT. To a large degree, intrastate motor carrier operations are subject to state safety regulations that mirror federal regulations. Matters such as the weight and dimensions of equipment are also subject to federal and state regulations. From time to time, various legislative proposals are introduced, including proposals to increase federal, state, or local taxes, including taxes on motor fuels, which may increase our costs or adversely impact the recruitment of drivers. We cannot predict whether, or in what form, any increase in such taxes applicable to us will be enacted.
Certain motor vehicle operators require registration with the DOT. This registration requires an acceptable operating record. The DOT periodically conducts compliance reviews and may revoke registration privileges based on certain safety performance criteria that could result in a suspension of operations.
We are subject to environmental laws and regulations, and future compliance, claims, and liabilities relating to such matters may have a material adverse effect on our results of operations, financial position or cash flows.
20
The nature of our operations, including the handling, transporting and disposing of a variety of fluids and substances, including hydraulic fracturing fluids and other regulated substances, air emissions, and wastewater discharges exposes us to some risks of environmental liability, including the release of pollutants from oil and natural gas wells and associated equipment to the environment. The cost of compliance with these laws can be significant. Failure to properly handle, transport or dispose of these materials or otherwise conduct our operations in accordance with these and other environmental laws could expose us to substantial liability for administrative, civil and criminal penalties, cleanup and site restoration costs and liability associated with releases of such materials, damages to natural resources and other damages, as well as potentially impair our ability to conduct our operations. Such liability is commonly on a strict, joint and several liability basis, without regard to fault. Liability may be imposed as a result of our conduct that was lawful at the time it occurred or the conduct of, or conditions caused by, prior operators or other third parties. Neighboring landowners and other third parties may file claims against us for personal injury or property damage allegedly caused by the release of pollutants into the environment. Environmental laws and regulations have changed in the past, and they may change in the future and become more stringent. Current and future claims and liabilities may have a material adverse effect on us because of potential adverse outcomes, defense costs, diversion of management resources, unavailability of insurance coverage and other factors. The ultimate costs of these liabilities are difficult to determine and may exceed any reserves we may have established. If existing environmental requirements or enforcement policies change, we may be required to make significant unanticipated capital and operating expenditures.
Our and our customers’ operations are subject to a series of risks arising out of the threat of climate change that could result in increased operating costs, limit the areas in which oil and natural gas production may occur, and reduce demand for the products and services we provide.
The threat of climate change continues to attract considerable attention in the United States and in foreign countries. Numerous proposals have been made and could continue to be made at the international, national, regional and state levels of government to monitor and limit existing emissions of GHGs as well as to restrict or eliminate such future emissions. As a result, our operations as well as the operations of our oil and natural gas exploration and production customers are subject to a series of regulatory, political, litigation, and financial risks associated with the production and processing of fossil fuels and emission of GHGs.
In the United States, no comprehensive climate change legislation has been implemented at the federal level. However, following the U.S. Supreme Court finding that GHG emissions constitute a pollutant under the CAA, the EPA has adopted regulations that, among other things, establish construction and operating permit reviews for GHG emissions from certain large stationary sources, require the monitoring and annual reporting of GHG emissions from certain petroleum and natural gas system sources in the United States, and implement New Source Performance Standards directing the reduction of methane from certain new, modified, or reconstructed facilities in the oil and natural gas sector, and together with the DOT, implementing GHG emissions limits on vehicles manufactured for operation in the United States. For example, in June 2016, the EPA finalized rules that establish new air emission controls for methane emissions from certain new, modified, or reconstructed equipment and processes in the oil and natural gas source category, including production, processing, transmission, and storage activities, otherwise known as Subpart OOOOa. Following the change in administration, there have been attempts to modify these regulations, and litigation is ongoing.
Additionally, various states and groups of states have adopted or are considering adopting legislation, regulations or other regulatory initiatives that are focused on such areas GHG cap and trade programs, carbon taxes, reporting and tracking programs, and restriction of emissions. At the international level, there is an agreement, the United Nations-sponsored "Paris Agreement," for nations to limit their GHG emissions through non-binding, individually-determined reduction goals every five years after 2020, although the United States has announced its withdrawal from such agreement, effective November 4, 2020.
Governmental, scientific, and public concern over the threat of climate change arising from GHG emissions has resulted in increasing political risks in the United States, including climate-change-related pledges made by some candidates seeking the office of the President of the United States in 2020. Some of these pledges have included calls to ban hydraulic fracturing, which could adversely impact our operations. Litigation risks are also increasing as a number of cities and other local governments have sought to bring suit against the largest oil and natural gas exploration and production companies in state or federal court, alleging among other things, that such companies created public nuisances by producing fuels that contributed to global warming effects, such as rising sea levels, and therefore are responsible for roadway and infrastructure damages as a result.
There are also increasing financial risks for fossil fuel producers as shareholders currently invested in fossil-fuel energy companies concerned about the potential effects of climate change may elect in the future to shift some or all of their investments into non-energy related sectors. Institutional lenders who provide financing to fossil-fuel energy
21
companies also have become more attentive to sustainable lending practices and some of them may elect not to provide funding for fossil fuel energy companies. Additionally, the lending practices of institutional lenders have been the subject of intensive lobbying efforts in recent years, oftentimes public in nature, by environmental activists, proponents of the international Paris Agreement, and foreign citizenry concerned about climate change not to provide funding for fossil fuel producers. Limitation of investments in and financings for fossil fuel energy companies could result in the restriction, delay or cancellation of drilling programs or development or production activities.
The adoption and implementation of new or more stringent international, federal or state legislation, regulations or other regulatory initiatives that impose more stringent standards for GHG emissions from the oil and natural gas sector or otherwise restrict the areas in which this sector may produce oil and natural gas or generate GHG emissions could result in increased costs of compliance or costs of consuming, and thereby reduce demand for, oil and natural gas, which could reduce demand for our services and products. Additionally, political, litigation and financial risks may result in our oil and natural gas customers restricting or cancelling production activities, incurring liability for infrastructure damages as a result of climatic changes, or impairing their ability to continue to operate in an economic manner, which also could reduce demand for our services and products. One or more of these developments could have a material adverse effect on our business, financial condition and results of operation
Moreover, climate change may cause more extreme weather conditions and increased volatility in seasonal temperatures. Extreme weather conditions can interfere with our operations and increase our costs, and damage resulting from extreme weather may not be fully insured.
Federal and state legislative and regulatory initiatives relating to hydraulic fracturing could result in increased costs and additional operating restrictions or delays.
Our hydraulic fracturing operations are a significant component of our business, and it is an important and common practice that is used to stimulate production of hydrocarbons, particularly oil and natural gas, from tight formations, including shales. The process, which involves the injection of water, sand and chemicals under pressure into formations to fracture the surrounding rock and stimulate production, is typically regulated by state oil and natural gas commissions. However, federal agencies have asserted regulatory authority over certain aspects of the process. For example, the EPA has previously issued a series of rules under the CAA that establish new emission control requirements for emissions of volatile organic compounds and methane from certain oil and natural gas production and natural gas processing operations and equipment. There have been several attempts to modify or rescind such regulations, and litigation is ongoing. Separately, the BLM finalized a rule governing hydraulic fracturing on federal lands but this rule was subsequently rescinded. Further, legislation to amend the Safe Drinking Water Act to repeal the exemption for hydraulic fracturing (except when diesel fuels are used) from the definition of “underground injection” and require federal permitting and regulatory control of hydraulic fracturing, as well as legislative proposals to require disclosure of the chemical constituents of the fluids used in the fracturing process, have been proposed in recent sessions of Congress. Several states and local jurisdictions in which we or our customers operate also have adopted or are considering adopting regulations that could restrict or prohibit hydraulic fracturing in certain circumstances, impose more stringent operating standards and/or require the disclosure of the composition of hydraulic fracturing fluids.
Federal and state governments have also investigated whether the disposal of produced water into underground injection wells has caused increased seismic activity in certain areas. For example, the United States Geological Survey identified eight states with the most significant hazards from induced seismicity, including Oklahoma, Kansas, Texas, Colorado, New Mexico, Arkansas, Ohio and Alabama. In response to concerns regarding induced seismicity, regulators in some states have imposed, or are considering imposing, additional requirements in the permitting of produced water disposal wells or otherwise to assess any relationship between seismicity and the use of such wells. For example, Oklahoma has issued rules for wastewater disposal wells in 2014 that imposed certain permitting and operating restrictions and reporting requirements on disposal wells in proximity to faults and also, from time to time, has implemented plans directing certain wells where seismic incidents have occurred to restrict or suspend disposal well operations. In particular, the Oklahoma Corporation Commission released well completion seismicity guidelines for operators in the SCOOP and STACK require hydraulic fracturing operations to be suspended following earthquakes of certain magnitudes in the vicinity. In addition, the Oklahoma Corporation Commission’s Oil and Gas Conservation Division has previously issued an order limiting future increases in the volume of oil and natural gas wastewater injected into the ground in an effort to reduce the number of earthquakes in the state. The Texas Railroad Commission has adopted similar rules. In addition, in December 2016, the EPA released its final report regarding the potential impacts of hydraulic fracturing on drinking water resources, concluding that “water cycle” activities associated with hydraulic fracturing may impact drinking water resources under certain limited circumstances. However, the EPA has imposed no regulatory limits as a result of this study.
22
Increased regulation of hydraulic fracturing and related activities (whether as a result of the EPA study results or resulting from other factors) could subject us and our customers to additional permitting and financial assurance requirements, more stringent construction specifications, increased monitoring, reporting and recordkeeping obligations, and plugging and abandonment requirements. New requirements could result in increased operational costs for us and our customers, and reduce the demand for our services.
Conservation measures, commercial development and technological advances could reduce demand for oil and natural gas and our services.
Fuel conservation measures, alternative fuel requirements, increasing consumer demand for alternatives to oil and natural gas, technological advances in fuel economy and energy generation devices could reduce demand for oil and natural gas, resulting in reduced demand for oilfield services. The impact of the changing demand for oil and natural gas services and products may have a material adverse effect on our business, financial condition, results of operations and cash flows.
The commercial development of economically‑viable alternative energy sources and related products (such as electric vehicles, wind, solar, geothermal, tidal, fuel cells and biofuels) could have a similar effect. In addition, certain U.S. federal income tax deductions currently available with respect to oil and natural gas exploration and development, including the allowance of percentage depletion for oil and natural gas properties, may be eliminated as a result of proposed legislation. Any future decreases in the rate at which oil and natural gas reserves are discovered or developed, whether due to the passage of legislation, increased governmental regulation leading to limitations, or prohibitions on exploration and drilling activity, including hydraulic fracturing, or other factors, could have a material adverse effect on our business and financial condition, even in a stronger oil and natural gas price environment.
We may be subject to claims for personal injury and property damage, which could materially adversely affect our financial condition and results of operations.
We operate with most of our customers under master service agreements (“MSAs”). We endeavor to allocate potential liabilities and risks between the parties in the MSAs. Generally, under our MSAs, including those relating to our hydraulic fracturing services, we assume responsibility for, including control and removal of, pollution or contamination which originates above surface and originates from our equipment or services. Our customer assumes responsibility for, including control and removal of, all other pollution or contamination which may occur during operations, including that which may result from seepage or any other uncontrolled flow of drilling fluids. We may have liability in such cases if we are negligent or commit willful acts. Generally, our customers also agree to indemnify us against claims arising from their employees’ personal injury or death to the extent that, in the case of our hydraulic fracturing operations, their employees are injured or their properties are damaged by such operations, unless resulting from our gross negligence or willful misconduct. Similarly, we generally agree to indemnify our customers for liabilities arising from personal injury to or death of any of our employees, unless resulting from gross negligence or willful misconduct of the customer. In addition, our customers generally agree to indemnify us for loss or destruction of customer‑owned property or equipment and in turn, we agree to indemnify our customers for loss or destruction of property or equipment we own. Losses due to catastrophic events, such as blowouts, are generally the responsibility of the customer. However, despite this general allocation of risk, we might not succeed in enforcing such contractual allocation, might incur an unforeseen liability falling outside the scope of such allocation or may be required to enter into an MSA with terms that vary from the above allocations of risk. Litigation arising from a catastrophic occurrence at a location where our equipment and services are being used may result in our being named as a defendant in lawsuits asserting large claims. As a result, we may incur substantial losses which could materially and adversely affect our financial condition and results of operation.
We are subject to cyber security risks. A cyber incident could occur and result in information theft, data corruption, operational disruption and/or financial loss.
The oil and natural gas industry has become increasingly dependent on digital technologies to conduct certain processing activities. For example, we depend on digital technologies to perform many of our services and process and record operational and accounting data. At the same time, cyber incidents, including deliberate attacks or unintentional events, have increased. The U.S. government has issued public warnings that indicate that energy assets might be specific targets of cyber security threats. Our technologies, systems and networks, and those of our vendors, suppliers and other business partners, may become the target of cyberattacks or information security breaches that could result in the unauthorized release, gathering, monitoring, misuse, loss or destruction of proprietary information, personal information and other data, or other disruption of our business operations. In addition, certain cyber incidents, such as unauthorized surveillance, may remain undetected for an extended period. Our systems and insurance coverage for protecting against cyber security risks, including cyberattacks, may not be sufficient and may not protect against or cover all of the losses we
23
may experience as a result of the realization of such risks. As cyber incidents continue to evolve, we may be required to expend additional resources to continue to modify or enhance our protective measures or to investigate and remediate the effects of cyber incidents.
We may grow through acquisitions and our failure to properly plan and manage those acquisitions may adversely affect our performance.
We have completed and may in the future pursue, asset acquisitions or acquisitions of businesses. Any acquisition of assets or businesses involves potential risks, including the failure to realize expected profitability, growth or accretion; environmental or regulatory compliance matters or liability; title or permit issues; the incurrence of significant charges, such as impairment of goodwill, or property, plant and equipment or restructuring charges; and the incurrence of unanticipated liabilities and costs for which indemnification is unavailable or inadequate. The process of upgrading acquired assets to our specifications and integrating acquired assets or businesses may also involve unforeseen costs and delays or other operational, technical and financial difficulties and may require a significant amount of time and resources and may divert management’s attention from existing operations or other priorities.
We must plan and manage any acquisitions effectively to achieve revenue growth and maintain profitability in our evolving market. Any failure to manage acquisitions effectively or integrate acquired assets or businesses into our existing operations successfully, or to realize the expected benefits from an acquisition or minimize any unforeseen operational difficulties, could have a material adverse effect on our business, financial condition, prospects or results of operations.
Our ability to use our net operating loss carryforwards may be limited.
As of December 31, 2019, we had approximately $304.7 million of federal net operating loss carryforwards some of which will begin to expire in 2035. After January 1, 2018, federal net operating loss carryforwards can be carried forward indefinitely. Approximately $229.5 million of our federal net operating loss carryforward relates to pre-2018 periods which are not subject to an annual 80% limitation of taxable income. Our state net operating losses is approximately $50.4 million and will begin to expire in 2024. Utilization of these net operating loss carryforwards (“NOLs”) depends on many factors, including our future income, which cannot be assured. In addition, Section 382 (“Section 382”) of the Internal Revenue Code of 1986, as amended (the “Code”), generally imposes an annual limitation on the amount of taxable income that may be offset by NOLs when a corporation has undergone an “ownership change” (as determined under Section 382). Generally, a change of more than 50% in the ownership of a corporation’s stock, by value, over a three‑year period constitutes an ownership change for U.S. federal income tax purposes. Any unused annual limitation may, subject to certain limitations, be carried over to later years. We may experience ownership changes, which may result in annual limitation under Section 382 determined by multiplying the value of our stock at the time of the ownership change by the applicable long‑term tax‑exempt rate as defined in Section 382, increased under certain circumstances as a result of recognizing built‑in gains in our assets existing at the time of the ownership change. The limitations arising from ownership changes may prevent utilization of our NOLs prior to their expiration. Future ownership changes or regulatory changes could further limit our ability to utilize our NOLs. To the extent we are not able to offset our future income with our NOLs, this could adversely affect our operating results and cash flows if we attain profitability.
The SEC’s pending investigation, the Logan Lawsuit, the Boca Raton Lawsuit, and the Chang Lawsuit could have a material adverse effect on our business, financial condition, results of operation, and cash flows.
In September 2019, a complaint, captioned Richard Logan, Individually and On Behalf of All Others Similarly Situated, Plaintiff, v. ProPetro Holding Corp., et al., (the “Logan Lawsuit”), was filed against the Company and certain of its current and former officers and directors in the U.S. District Court for the Western District of Texas.
In April 2020, Lead Plaintiffs Nykredit Portefølje Administration A/S, Oklahoma Firefighters Pension and Retirement System, Oklahoma Law Enforcement Retirement System, Oklahoma Police Pension and Retirement System, and Oklahoma City Employee Retirement System, and additional named plaintiff Police and Fire Retirement System of the City of Detroit, individually and on behalf of a putative class of shareholders who purchased the Company’s common stock between March 17, 2017 and March 13, 2020, filed a second amended class action complaint in the U.S. District Court for the Western District of Texas in the Logan Lawsuit, alleging violations of Sections 10(b) and 20(a) of the Exchange Act, as amended, and Rule l0b-5 promulgated thereunder, and Sections 11 and 15 of the Securities Act, as amended, based on allegedly inaccurate or misleading statements, or omissions of material facts, about the Company’s business, operations and prospects.
In January 2020, Boca Raton Firefighters’ and Police Pension Fund (“Boca Raton”) filed a shareholder derivative suit in the U.S. District Court for the Western District of Texas (the “Boca Raton Lawsuit”) against certain of the
24
Company’s current and former officers and directors (the “Boca Raton Defendants”). The Company was named as a nominal defendant only. The claims include (i) breaches of fiduciary duties, (ii) unjust enrichment and (iii) contribution. Boca Raton did not quantify any alleged damages in its complaint but, in addition to attorneys’ fees and costs, Boca Raton seeks various forms of relief, including (i) damages sustained by the Company as a result of the Boca Raton Defendants’ alleged misconduct, (ii) punitive damages and (iii) equitable relief in the form of improvements to the Company’s governance and controls.
In April 2020, Jye-Chun Chang filed a shareholder derivative suit in the U.S. District Court for the Western District of Texas (the “Chang Lawsuit”) against certain of the Company’s current and former officers and directors (the “Chang Defendants”). The Company was named as a nominal defendant only. The claims include (i) violations of section 14(a) of the Exchange Act, (ii) breach of fiduciary duties, (iii) unjust enrichment, (iv) abuse of control, (v) gross mismanagement and (vi) waste of corporate assets. Chang did not quantify any alleged damages in its complaint but, in addition to attorneys’ fees and costs, Chang seeks various forms of relief, including (i) declaring that Chang may sustain the action on behalf of the Company, (ii) declaring that the Chang Defendants breached their fiduciary duties to the Company, (iii) damages sustained by the Company as a result of the Chang Defendants’ alleged misconduct, (iv) equitable relief in the form of improvements to the Company’s governance and controls and (v) restitution.
In October 2019, the Company received a letter from the SEC indicating that the SEC has opened an investigation into the Company and requesting that the Company provide information and documents, including documents related to the Expanded Audit Committee Review and related events.
We are presently unable to predict the duration, scope or result of the SEC’s investigation, the Logan Lawsuit, the Boca Raton Lawsuit, the Chang Lawsuit, or any other related lawsuit or investigation.
The ongoing SEC investigation, the Logan Lawsuit, the Boca Raton Lawsuit, the Chang Lawsuit and any related future litigation give rise to risks and uncertainties that could adversely affect our business, results of operations and financial condition. Such risks and uncertainties include, but are not limited to, uncertainty as to the scope, timing and ultimate findings of the matters under review by the SEC; adverse effects of the investigation, including the potential impact to the Company or members of its management team in the event of an adverse outcome and on the market price of the Company’s common stock; the costs and expenses of the SEC investigation, the Logan Lawsuit, the Boca Raton Lawsuit, and the Chang lawsuit including legal fees and possible monetary penalties in the event of an adverse outcome; the risk of additional potential litigation or regulatory action arising from these matters, including the Logan Lawsuit, the Boca Raton Lawsuit, and the Chang Lawsuit; the timing of the review by, and the conclusions of, the Company’s independent registered public accounting firm regarding these matters; the potential identification of additional deficiencies in internal controls over financial reporting or disclosure controls and procedures and the impact of the same; and potential reputational damage that the Company may suffer as a result of these matters.
The SEC has a broad range of civil sanctions available should it commence an enforcement action, including injunctive relief, disgorgement, fines, penalties, or an order to take remedial action. The imposition of any of these sanctions, fines, or remedial measures could have a material adverse effect on our business, results of operation and financial condition.
The outcome of the Logan Lawsuit, the Boca Raton Lawsuit, the Chang Lawsuit or any other litigation is necessarily uncertain. We could be forced to expend significant resources in the defense of these lawsuits or future ones, and we may not prevail.
We maintain director and officer insurance; however, our insurance coverage is subject to certain exclusions (including, for example, any required SEC disgorgement or penalties) and we are responsible for meeting certain deductibles under the policies. Moreover, we cannot assure you that our insurance coverage will adequately protect us from claims made in the Logan Lawsuit, the Boca Raton Lawsuit, the Chang Lawsuit, the SEC investigation or any future claims. Further, as a result of the pending litigation and investigation the costs of insurance may increase and the availability of coverage may decrease. As a result, we may not be able to maintain our current levels of insurance at a reasonable cost, or at all.
25
We have identified material weaknesses in our internal control over financial reporting and may identify additional material weaknesses in the future or otherwise fail to maintain an effective system of internal controls, which may result in material misstatements of our financial statements or cause us to fail to meet our periodic reporting obligations.
We are required to comply with certain provisions of Section 404 of the Sarbanes-Oxley Act of 2002 (“Section 404”). Section 404 requires that we document and test our internal control over financial reporting and issue our management’s assessment of our internal control over financial reporting. This section also requires that our independent registered public accounting firm issue an attestation report on such internal control.
Our management is responsible for establishing and maintaining adequate internal control over financial reporting, as defined in Rules 13a-15(f) and 15d-15(f) under the Exchange Act. As disclosed in Item 9A, following the filing of our Annual Report on Form 10-K for the year ended December 31, 2018, management identified certain material weaknesses in our internal control over financial reporting that existed as of December 31, 2018 relating to related party transactions and other areas, which resulted in the failure of the following COSO principles: (i) the organization demonstrates commitment to integrity and ethical values; (ii) the board of directors demonstrates independence from management and exercises oversight of the development and performance of internal control; (iii) management establishes, with board oversight, structures, reporting lines, and appropriate authorities and responsibilities in pursuit of objectives; (iv) the organization demonstrates a commitment to attract, develop, and retain competent individuals in alignment with objectives; (v) the organization holds individuals accountable for their internal control related responsibilities in the pursuit of objectives; (vi) the organization internally communicates information, including objectives and responsibilities for internal control, necessary to support the functioning of internal control; (vii) the organization communicates with external parties regarding matters affecting the functioning of internal control; (viii) the organization selects and develops control activities that contribute to the mitigation of risks to the achievement of objectives to acceptable levels; (ix) the organization deploys control activities through policies that establish what is expected and procedures that put policies into action; and (x) controls designed to sufficiently identify, evaluate, and disclose related party transactions. A material weakness is defined as a deficiency, or a combination of deficiencies, in internal control over financial reporting, such that there is a reasonable possibility that a material misstatement of our annual or interim financial statements will not be prevented or detected on a timely basis. As such, management concluded that we did not design and implement effective control activities based on the criteria established in the framework set forth by the Committee of Sponsoring Organizations of the Treadway Commission (“COSO”) in “2013 Internal Control-Integrated Framework.” As a result of these material weaknesses, the COSO components of Control Environment, Information and Communication and Control Activities were not present and functioning.
We have begun taking steps to implement controls to remediate the material weaknesses, including: (i) appointing new executive officers with extensive public company experience to improve the tone at the top, communication with the Board and compliance with policies within the Company; (ii) enhancing certain policies of the Company, including the Code of Ethics and Conduct, Expense Reimbursement, Travel and Entertainment, and Delegation of Responsibilities and Authority policies and enhancing monitoring of compliance with such policies; (iii) designing and implementing control activities related to transactions involving potential conflicts of interest and related parties, and evaluation of whistleblower allegations; and (iv) forming a disclosure committee and appointing a Chief Disclosure Officer to provide improved corporate governance related to disclosures the Company provides to the public and other external parties.
The material weaknesses described above or any newly identified material weakness could limit our ability to prevent or detect a misstatement of our accounts or disclosures that could result in a material misstatement of our annual or interim financial statements. We cannot assure you that the measures we have taken to date, or any measures we may take in the future, will be sufficient to remediate the control deficiencies that led to the material weaknesses in our internal control over financial reporting described above or to avoid potential future material weaknesses.
Effective internal controls are necessary for us to provide reliable financial reports and prevent fraud. If we are unable to successfully remediate our existing material weaknesses or any future material weakness in our internal control over financial reporting, or identify any additional material weaknesses that may exist, the accuracy and timing of our financial reporting may be adversely affected, we may be unable to maintain compliance with securities law requirements regarding timely filing of periodic reports in addition to applicable stock exchange listing requirements, we may be unable to prevent fraud, investors may lose confidence in our financial reporting, we may lose customers, our ability to obtain financing may be reduced, and our stock price may decline as a result, each of which could have a material adverse effect on our business, financial condition, prospects, results of operations and cash flows. For example, as a result of the ineffective control environment and other related matters, the Company did not timely file its Quarterly Reports on Form
26
10-Q for the quarters ended June 30, 2019, September 30, 2019 and March 31, 2020 and its Annual Report on Form 10-K for the year ended December 31, 2019.
Certain provisions of our certificate of incorporation, bylaws and stockholder rights plan, as well as Delaware law, may discourage acquisition bids or merger proposals, which may adversely affect the market price of our common stock.
Our certificate of incorporation authorizes our board of directors (the “Board”) to issue preferred stock without shareholder approval. If our Board elects to issue preferred stock, it could be more difficult for a third party to acquire us. In addition, some provisions of our certificate of incorporation and bylaws could make it more difficult for a third party to acquire control of us, even if the change of control would be beneficial to our shareholders, including:
• |
limitations on the removal of directors; |
• |
limitations on the ability of our shareholders to call special meetings; |
• |
advance notice provisions for shareholder proposals and nominations for elections to the Board to be acted upon at meetings of shareholders; |
• |
providing that the Board is expressly authorized to adopt, or to alter or repeal our bylaws; and |
• |
establishing advance notice and certain information requirements for nominations for election to our Board or for proposing matters that can be acted upon by shareholders at shareholder meetings. |
In addition, our Board adopted a short-term stockholder rights plan that would likely discourage a hostile attempt to acquire control of us.
Our business could be negatively affected as a result of the actions of activist shareholders.
Publicly traded companies have increasingly become subject to campaigns by investors seeking to increase shareholder value by advocating corporate actions such as financial restructuring, increased borrowing, special dividends, stock repurchases, sales of assets or even sale of the entire company. Given our shareholder composition and other factors, it is possible such shareholders or future activist shareholders may attempt to effect such changes or acquire control over us. Responding to proxy contests and other actions by such activist shareholders or others in the future would be costly and time-consuming, disrupt our operations and divert the attention of our Board and senior management from the pursuit of business strategies, which could adversely affect our results of operations and financial condition. Additionally, perceived uncertainties as to our future direction as a result of shareholder activism or changes to the composition of the Board may lead to the perception of a change in the direction of our business, instability or lack of continuity which may be exploited by our competitors, cause concern to our current or potential customers, and make it more difficult to attract and retain qualified personnel. If customers choose to delay, defer or reduce transactions with us or transact with our competitors instead of us because of any such issues, then our business, financial condition, revenues, results of operations and cash flows could be adversely affected.
Our certificate of incorporation designates the Court of Chancery of the State of Delaware as the sole and exclusive forum for certain types of actions and proceedings that may be initiated by our shareholders, which could limit our shareholders’ ability to obtain a favorable judicial forum for disputes with us or our directors, officers, employees or agents.
Our certificate of incorporation provides that, unless we consent in writing to the selection of an alternative forum, the Court of Chancery of the State of Delaware will, to the fullest extent permitted by applicable law, be the sole and exclusive forum for (i) any derivative action or proceeding brought on our behalf, (ii) any action asserting a claim of breach of a fiduciary duty owed by any of our directors, officers, employees or agents to us or our shareholders, (iii) any action asserting a claim arising pursuant to any provision of the Delaware General Corporation Law (the “DGCL”), our certificate of incorporation or our bylaws, or (iv) any action asserting a claim against us that is governed by the internal affairs doctrine, in each such case subject to such Court of Chancery having personal jurisdiction over the indispensable parties named as defendants therein.
The exclusive forum provision would not apply to suits brought to enforce any liability or duty created by the Securities Act or the Exchange Act or any other claim for which the federal courts have exclusive jurisdiction. To the extent that any such claims may be based upon federal law claims, Section 27 of the Exchange Act creates exclusive federal jurisdiction over all suits brought to enforce any duty or liability created by the Exchange Act or the rules and
27
regulations thereunder. Furthermore, Section 22 of the Securities Act creates concurrent jurisdiction for federal and state courts over all suits brought to enforce any duty or liability created by the Securities Act or the rules and regulations thereunder.
The enforceability of similar choice of forum provisions in other companies’ certificates of incorporation or similar governing documents has been challenged in legal proceedings, and it is possible that a court could find the choice of forum provisions contained in our certificate of incorporation to be inapplicable or unenforceable, including with respect to claims arising under the U.S. federal securities laws.
Any person or entity purchasing or otherwise acquiring any interest in shares of our capital stock will be deemed to have notice of, and consented to, the provisions of our certificate of incorporation regarding exclusive forum. This choice of forum provision may limit a shareholder’s ability to bring a claim in a judicial forum that it finds favorable for disputes with us or our directors, officers, employees or agents, which may discourage such lawsuits against us and such persons. Alternatively, if a court were to find these provisions of our certificate of incorporation inapplicable to, or unenforceable in respect of, one or more of the specified types of actions or proceedings, we may incur additional costs associated with resolving such matters in other jurisdictions, which could adversely affect our business, financial condition or results of operations.
The New York Stock Exchange could commence procedures to delist our common stock, in the event we do not timely file all required periodic reports with the SEC, in which case the market price of our shares might decline and become more volatile and our stockholders’ ability to trade in our stock could be adversely affected.
As a result of our failure to timely file our Quarterly Reports on Form 10-Q for the three months ended June 30, 2019, for the three months ended September 30, 2019 and Annual Report on Form 10-K for the year ended December 31, 2019 with the SEC, as previously disclosed, on August 15, 2019 we received a notice from the New York Stock Exchange (the “NYSE”) informing us that we were not in compliance with the NYSE’s continued listing requirements under the timely filing criteria set forth in Section 802.01E of the NYSE Listed Company Manual as a result of our failure to timely file our Quarterly Report on Form 10-Q for the three months ended June 30, 2019. Under the NYSE rules, we were provided with six months from August 15, 2019 to file the delinquent Quarterly Report on Form 10-Q for the three months ended June 30, 2019. On February 14, 2020, the NYSE granted us an additional extension to July 15, 2020 to file our all delinquent Quarterly and Annual Reports. Subsequently, we have failed to timely file our Quarterly Report for the three months ended March 31, 2020. While we intend to become current before July 15, 2020, we remain subject to the procedures set forth in the NYSE’s listing standards related to late filings and subject to the risk of delisting. If our common stock were delisted, there could be no assurance whether or when it would again be listed for trading on NYSE or any other exchange. Further, the market price of our shares might decline and become more volatile, and our stockholders may find that their ability to trade in our stock would be adversely affected. Furthermore, institutions whose charters do not allow them to hold securities in unlisted companies might sell our shares, perhaps very promptly, which could have a further adverse effect on the price of our stock.
The market price of our common stock is subject to volatility.
The market of our common stock could be subject to wide fluctuations in response to, and the level of trading of our common stock may be affected by, numerous factors, many of which are beyond our control. These factors include, among other things, our limited trading volume, the concentration of holdings or our common stock, actual or anticipated variations in our operating results and cash flow, the nature and content of our earnings releases, announcements or events that impact our products, customers, competitors or markets, business conditions in our markets and the general state of the securities markets and the market for energy-related stocks, as well as general economic and market conditions and other factors that may affect our future results, including those described in this report. Significant sales of our common stock, or the expectation of these sales, by significant shareholders, officers or directors could materially and adversely affect the market price of our common stock.
There may be future sales or other dilution of our equity, which may adversely affect the market price of our common stock.
We are not restricted from issuing additional common stock, including securities that are convertible into or exchangeable for, or that represent a right to receive, common stock. Any issuance of additional shares of our common stock or convertible securities will dilute the ownership interest of our common stockholders. Sales of a substantial number of shares of our common stock or other equity-related securities in the public market, or the perception that these sales could occur, could depress the market price of our common stock and impair our ability to raise capital through the
28
sale of additional equity securities. We cannot predict the effect that future sales of our common stock or other equity-related securities would have on the market price of our common stock.
29
Item 1B. Unresolved Staff Comments.
None.
Item 2. Properties
Our corporate headquarters is located at 1706 S. Midkiff, Midland, Texas 79701. In addition to our headquarters, we also own and lease other properties that are used for field offices, yards or storage in the Permian Basin. We believe that our facilities are adequate for our current operations.
Item 3. Legal Proceedings.
In September 2019, a complaint, captioned Richard Logan, Individually and On Behalf of All Others Similarly Situated, Plaintiff, v. ProPetro Holding Corp., et al., was filed against the Company and certain of its current and former officers and directors in the U.S. District Court for the Western District of Texas.
In April 2020, Lead Plaintiffs Nykredit Portefølje Administration A/S, Oklahoma Firefighters Pension and Retirement System, Oklahoma Law Enforcement Retirement System, Oklahoma Police Pension and Retirement System, and Oklahoma City Employee Retirement System, and additional named plaintiff Police and Fire Retirement System of the City of Detroit, individually and on behalf of a putative class of shareholders who purchased the Company’s common stock between March 17, 2017 and March 13, 2020, filed a second amended class action complaint in the U.S. District Court for the Western District of Texas in the Logan Lawsuit, alleging violations of Sections 10(b) and 20(a) of the Exchange Act, as amended, and Rule l0b-5 promulgated thereunder, and Sections 11 and 15 of the Securities Act, as amended, based on allegedly inaccurate or misleading statements, or omissions of material facts, about the Company’s business, operations and prospects.
In January 2020, Boca Raton Firefighters’ and Police Pension Fund filed a shareholder derivative suit in the U.S. District Court for the Western District of Texas against certain of the Company’s current and former officers and directors. The Company was named as a nominal defendant only. The claims include (i) breaches of fiduciary duties, (ii) unjust enrichment and (iii) contribution. Boca Raton did not quantify any alleged damages in its complaint but, in addition to attorneys’ fees and costs, Boca Raton seeks various forms of relief, including (i) damages sustained by the Company as a result of the Boca Raton Defendants’ alleged misconduct, (ii) punitive damages and (iii) equitable relief in the form of improvements to the Company’s governance and controls.
In April 2020, Jye-Chun Chang filed a shareholder derivative suit in the U.S. District Court for the Western District of Texas against certain of the Company’s current and former officers and directors. The Company was named as a nominal defendant only. The claims include (i) violations of section 14(a) of the Exchange Act, (ii) breach of fiduciary duties, (iii) unjust enrichment, (iv) abuse of control, (v) gross mismanagement and (vi) waste of corporate assets. Chang did not quantify any alleged damages in its complaint but, in addition to attorneys’ fees and costs, Chang seeks various forms of relief, including (i) declaring that Chang may sustain the action on behalf of the Company, (ii) declaring that the Chang Defendants breached their fiduciary duties to the Company, (iii) damages sustained by the Company as a result of the Chang Defendants’ alleged misconduct, (iv) equitable relief in the form of improvements to the Company’s governance and controls and (v) restitution.
In October 2019, the Company received a letter from the SEC indicating that the SEC has opened an investigation into the Company and requesting that the Company provide information and documents, including documents related to the Expanded Audit Committee Review and related events. The Company has cooperated and expects to continue to cooperate with the SEC’s investigation.
We are presently unable to predict the duration, scope or result of the SEC’s investigation, the Logan Lawsuit, the Boca Raton Lawsuit, the Chang Lawsuit, or any other related lawsuit or investigation.
From time to time, we may be subject to various other legal proceedings and claims incidental to or arising in the ordinary course of our business.
30
Item 4. Mine and Safety Disclosures
None.
31
Part II
Item 5. |
Market for Registrant’s Common Equity, Related Stockholder Matters and Issuer Purchases of Equity Securities. |
Market Information
On March 22, 2017, we consummated our initial public offering (“IPO”) of our common stock at a price of $14.00 per share. Our common stock is traded on the New York Stock Exchange under the symbol “PUMP”.
Holders
As of December 31, 2019, there were 100,624,099 shares of common stock outstanding, held of record by 4 holders. The number of record holders of our common stock does not include Depository Trust Company participants or beneficial owners holding shares through nominee names.
Dividend
We do not anticipate declaring or paying any cash dividends to holders of our common stock in the foreseeable future. We currently intend to retain future earnings, if any, to finance the growth of our business and repay borrowings under our ABL Credit Facility. Our future dividend policy is within the discretion of our Board and will depend upon then‑existing conditions, including our results of operations, financial condition, capital requirements, investment opportunities, statutory restrictions on our ability to pay dividends and other factors our Board may deem relevant. In addition, our ABL Credit Facility places restrictions on our ability to pay cash dividends.
Performance Graph
The quarterly changes for the periods shown in the following graph are based on the assumption that $100 had been invested in our common stock, the Russell 2000 Index (“Russell 2000”) and a self-constructed peer group index of comparable companies (“Peer Group”) on March 17, 2017 (the first trading date of our common stock), and that all dividends were reinvested at the closing prices of the dividend payment dates. The relevant companies included in our Peer Group consists of Liberty Oilfield Services, Inc., Nextier Oilfield Solution Inc., RPC, Inc., Calfrac Well Services Ltd., Patterson-UTI Energy, Inc. and Mammoth Energy Services, Inc. Subsequent measurement points are the last trading days of each quarter. We did not provide a five-year graph because we became a publicly traded company in March of 2017. The total cumulative dollar returns shown on the graph represent the value that such investments would have had on the last trading date of 2019. The calculations exclude trading commissions and taxes. The stock price performance on the following graph and table is not necessarily indicative of future stock price performance.
32
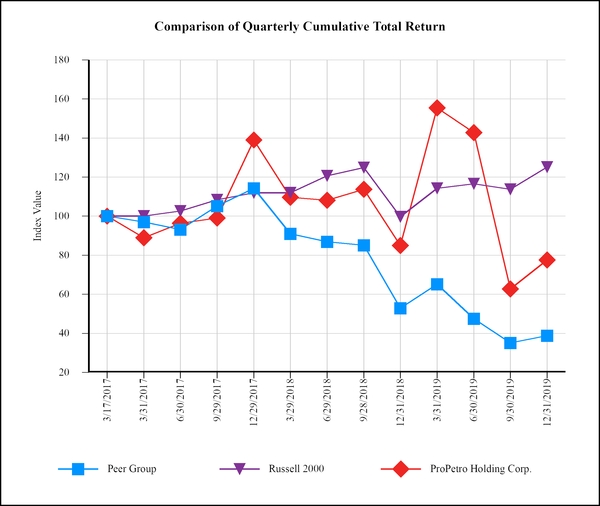
Date |
Peer Group |
Russell 2000 |
ProPetro Holding Corp. |
|||||||||
3/17/2017 |
$ |
100.0 |
$ |
100.0 |
$ |
100.0 |
||||||
3/31/2017 |
$ |
97.0 |
$ |
100.1 |
$ |
88.9 |
||||||
6/30/2017 |
$ |
93.2 |
$ |
102.6 |
$ |
96.3 |
||||||
9/29/2017 |
$ |
105.2 |
$ |
108.4 |
$ |
99.0 |
||||||
12/29/2017 |
$ |
114.3 |
$ |
112.0 |
$ |
139.0 |
||||||
3/29/2018 |
$ |
91.0 |
$ |
111.9 |
$ |
109.6 |
||||||
6/29/2018 |
$ |
86.9 |
$ |
120.6 |
$ |
108.1 |
||||||
9/28/2018 |
$ |
85.1 |
$ |
124.9 |
$ |
113.7 |
||||||
12/31/2018 |
$ |
52.9 |
$ |
99.7 |
$ |
85.0 |
||||||
3/31/2019 |
$ |
65.2 |
$ |
114.2 |
$ |
155.4 |
||||||
6/30/2019 |
$ |
47.5 |
$ |
116.6 |
$ |
142.8 |
||||||
9/30/2019 |
$ |
35.1 |
$ |
113.8 |
$ |
62.7 |
||||||
12/31/2019 |
$ |
38.8 |
$ |
125.1 |
$ |
77.6 |
||||||
33
Item 6. Selected Historical Financial Data.
The following table presents the available selected historical financial data of ProPetro Holding Corp. for the years indicated. There were no factors that materially affect the comparability of the information in the selected historical financial data presented, except for the purchase of certain pressure pumping assets (510,000 HHP) and real property from Pioneer and Pioneer Pressure Pumping Services, LLC, consummated on December 31, 2018 (the “Pioneer Pressure Pumping Acquisition”) and expansion of our fleet size over the years presented, that has resulted in higher revenues and profitability.
The selected historical consolidated financial and operating data presented below should be read in conjunction with “Risk Factors,” “Management’s Discussion and Analysis of Financial Condition and Results of Operations” and our consolidated financial statements and the related notes and other financial data included elsewhere in this Annual Report on Form 10-K.
34
(In thousands, except for per share data) |
|||||||||||||||||||
Year Ended December 31, |
|||||||||||||||||||
2019 |
2018 |
2017 |
2016 |
2015 |
|||||||||||||||
Statement of Operations Data: |
|||||||||||||||||||
Revenue: |
|||||||||||||||||||
Pressure pumping |
$ |
2,001,627 |
$ |
1,658,403 |
$ |
945,040 |
$ |
409,014 |
$ |
510,198 |
|||||||||
All other |
50,687 |
46,159 |
36,825 |
27,906 |
59,420 |
||||||||||||||
Total revenue |
2,052,314 |
1,704,562 |
981,865 |
436,920 |
569,618 |
||||||||||||||
Costs and Expenses: |
|||||||||||||||||||
Cost of services(1)
|
1,470,356 |
1,270,577 |
813,823 |
404,140 |
483,338 |
||||||||||||||
General and administrative(2)
|
105,076 |
53,958 |
49,215 |
26,613 |
27,370 |
||||||||||||||
Depreciation and amortization |
145,304 |
88,138 |
55,628 |
43,542 |
50,134 |
||||||||||||||
Impairment expense |
3,405 |
— |
— |
7,482 |
36,609 |
||||||||||||||
Loss on disposal of assets |
106,811 |
59,220 |
39,086 |
22,529 |
21,268 |
||||||||||||||
Total costs and expenses |
1,830,952 |
1,471,893 |
957,752 |
504,306 |
618,719 |
||||||||||||||
Operating Income (Loss) |
221,362 |
232,669 |
24,113 |
(67,386 |
) |
(49,101 |
) |
||||||||||||
Other Income (Expense): |
|||||||||||||||||||
Interest expense |
(7,141 |
) |
(6,889 |
) |
(7,347 |
) |
(20,387 |
) |
(21,641 |
) |
|||||||||
Gain on extinguishment of debt |
— |
— |
— |
6,975 |
— |
||||||||||||||
Other expense |
(717 |
) |
(663 |
) |
(1,025 |
) |
(321 |
) |
(499 |
) |
|||||||||
Total other income (expense) |
(7,858 |
) |
(7,552 |
) |
(8,372 |
) |
(13,733 |
) |
(22,140 |
) |
|||||||||
Income (loss) before income taxes |
213,504 |
225,117 |
15,741 |
(81,119 |
) |
(71,241 |
) |
||||||||||||
Income tax (expense) benefit |
(50,494 |
) |
(51,255 |
) |
(3,128 |
) |
27,972 |
25,388 |
|||||||||||
Net income (loss) |
$ |
163,010 |
$ |
173,862 |
$ |
12,613 |
$ |
(53,147 |
) |
$ |
(45,853 |
) |
|||||||
Share Information: |
|||||||||||||||||||
Net income (loss) per common share: |
|||||||||||||||||||
Basic |
$ |
1.62 |
$ |
2.08 |
$ |
0.17 |
$ |
(1.19 |
) |
$ |
(1.31 |
) |
|||||||
Diluted |
$ |
1.57 |
$ |
2.00 |
$ |
0.16 |
$ |
(1.19 |
) |
$ |
(1.31 |
) |
|||||||
Weighted average common shares outstanding: |
|||||||||||||||||||
Basic |
100,472 |
83,460 |
76,371 |
44,787 |
34,993 |
||||||||||||||
Diluted |
103,750 |
87,046 |
79,583 |
44,787 |
34,993 |
||||||||||||||
Balance Sheet Data as of: |
|||||||||||||||||||
Cash and cash equivalents |
$ |
149,036 |
$ |
132,700 |
$ |
23,949 |
$ |
133,596 |
$ |
34,310 |
|||||||||
Property and equipment — net |
$ |
1,047,535 |
$ |
912,846 |
$ |
470,910 |
$ |
263,862 |
$ |
291,838 |
|||||||||
Total assets |
$ |
1,436,111 |
$ |
1,274,522 |
$ |
719,032 |
$ |
541,422 |
$ |
446,454 |
|||||||||
Long-term debt — net |
$ |
130,000 |
$ |
70,000 |
$ |
57,178 |
$ |
159,407 |
$ |
236,876 |
|||||||||
Total shareholders’ equity |
$ |
969,305 |
$ |
797,355 |
$ |
413,252 |
$ |
221,009 |
$ |
69,571 |
|||||||||
Cash Flow Statement Data: |
|||||||||||||||||||
Net cash provided by operating activities |
$ |
455,290 |
$ |
393,079 |
$ |
109,257 |
$ |
10,659 |
$ |
81,230 |
|||||||||
Net cash used in investing activities |
$ |
(495,299 |
) |
$ |
(280,604 |
) |
$ |
(281,469 |
) |
$ |
(41,688 |
) |
$ |
(62,776 |
) |
||||
Net cash provided by (used in) financing activities |
$ |
56,345 |
$ |
(3,724 |
) |
$ |
62,565 |
$ |
130,315 |
$ |
(15,216 |
) |
|||||||
(1) |
Exclusive of depreciation and amortization. |
(2) |
Inclusive of stock‑based compensation. |
35
Item 7. Management’s Discussion and Analysis of Financial Condition and Results of Operations.
You should read the following discussion and analysis of our financial condition and results of operations together with our audited consolidated financial statements and the related notes included in this Annual Report. Some of the information contained in this discussion and analysis or set forth elsewhere in this Annual Report, including information with respect to our plans and strategy for our business and related financing, includes forward‑looking statements that involve risks and uncertainties. You should read the “Risk Factors” section of this Annual Report for a discussion of important factors that could cause actual results to differ materially from the results described in or implied by the forward‑looking statements contained in the following discussion and analysis.
Basis of Presentation
This discussion of our results of operations omits our results of operations for the year ended December 31, 2017 and the comparison of our results of operations for the years ended December 31, 2018 and 2017, which may be found in our Annual Report on Form 10-K for the year ended December 31, 2018, filed with the SEC on March 1, 2019.
Unless otherwise indicated, references in this “Management’s Discussion and Analysis of Financial Condition and Results of Operations” to “ProPetro Holding Corp.,” “the Company,” “we,” “our,” “us” or like terms refer to ProPetro Holding Corp. and its subsidiary.
Overview
Our Business
We are a growth‑oriented, Midland, Texas‑based oilfield services company providing hydraulic fracturing and other complementary services to leading upstream oil and gas companies engaged in the exploration and production, or E&P, of North American unconventional oil and natural gas resources. Our operations are primarily focused in the Permian Basin, where we have cultivated longstanding customer relationships with some of the region’s most active and well‑capitalized E&P companies. The Permian Basin is widely regarded as one of the most prolific oil‑producing areas in the United States, and we believe we are one of the leading providers of hydraulic fracturing services in the region by hydraulic horsepower.
Changes to our customers’ well design, shale formations, operating conditions and new technology have resulted in continuous changes to the number of pumps, or units, that constitute a fleet. As a result of the asymmetric nature of the number of pumps that constitute a fleet across our customer base, which we believe will continue to evolve, we view HHP to also be an appropriate metric to measure our available hydraulic fracturing capacity. As such, our total available HHP at December 31, 2019 was 1,469,000 HHP, which was comprised of 1,415,000 HHP of conventional HHP and 54,000 HHP of our newly purchased DuraStim® hydraulic fracturing technology. With the continuous evaluation and changes to the number of pumps or HHP that constitute a fleet, we believe that our available fleet capacity could decline as we reconfigure our fleets to increase active HHP and back up HHP based on our customers’ and operational needs. Our first DuraStim® hydraulic fracturing pumps of 54,000 HHP was delivered in December 2019 and deployed to a customer in January 2020. We expect that the additional DuraStim® hydraulic fracturing pumps of 54,000 HHP will be delivered during 2020. We also have an option to purchase up to an additional 108,000 HHP of DuraStim® hydraulic fracturing pumps in the future through April 30, 2021. The DuraStim® technology is powered by electricity. We purchased two gas turbines to provide electrical power for the DuraStim® fleets. The electrical power sources for future DuraStim® fleets are still being evaluated and could either be supplied by the Company, customers or a third-party supplier.
Pioneer Pressure Pumping Acquisition
On December 31, 2018, we consummated the purchase of pressure pumping and related assets of Pioneer Natural Resources USA, Inc.(“Pioneer”) and Pioneer Pumping Services, LLC (the “Pioneer Pressure Pumping Acquisition”). The pressure pumping assets acquired included hydraulic fracturing pumps of 510,000 HHP, four coiled tubing units and the associated equipment maintenance facility. In connection with the acquisition, we became a long-term service provider to Pioneer under a Pressure Pumping Services Agreement (the “Pioneer Services Agreement”), providing pressure pumping and related services for a term of up to 10 years; provided, that Pioneer has the right to terminate the Pioneer Services Agreement, in whole or part, effective as of December 31 of each of the calendar years of 2022, 2024 and 2026. Pioneer can increase the number of committed fleets prior to December 31, 2022. Pursuant to the Pioneer Services Agreement, the Company is entitled to receive compensation if Pioneer were to idle committed fleets (“idle fees”); however, we are first required to use all economically reasonable effort to deploy the idled fleets to another customer. At the present, we
36
have eight fleets committed to Pioneer. During times when there is a significant reduction in overall demand for our services, the idle fees could represent a material portion of our revenues.
Commodity Price and Other Economic Conditions
The global public health crisis associated with the COVID-19 pandemic has and is anticipated to continue to have an adverse effect on global economic activity for the immediate future and has resulted in travel restrictions, business closures and the institution of quarantining and other restrictions on movement in many communities. The slowdown in global economic activity attributable to COVID-19 has resulted in a dramatic decline in the demand for energy which directly impacts our industry and the Company. In addition, global crude oil prices experienced a collapse starting in early March 2020 as a direct result of failed negotiations between OPEC, and Russia. In response to the global economic slowdown, OPEC had recommended a decrease in production levels in order to accommodate reduced demand. Russia rejected the recommendation of OPEC as a concession to U.S. producers. After the failure to reach an agreement, Saudi Arabia, a dominant member of OPEC, and other Persian Gulf OPEC members announced intentions to increase production and offer price discounts to buyers in certain geographic regions.
As the breadth of the COVID-19 health crisis expanded throughout the month of March 2020 and governmental authorities implemented more restrictive measures to limit person-to-person contact, global economic activity continued to decline commensurately. The associated impact on the energy industry has been adverse and continued to be exacerbated by the unresolved conflict regarding production. In the second week of April, OPEC reconvened to discuss the matter of production cuts in light of unprecedented disruption and supply and demand imbalances that expanded since the failed negotiations in early March 2020. Tentative agreements were reached to cut production by up to 10 million BOPD, with allocations to be made among the OPEC+ participants. Some of these production cuts went into effect in the first half of May 2020, however, commodity prices remain depressed as a result of an increasingly utilized global storage network and near-term demand loss attributable to the COVID-19 health crisis and related economic slowdown.
The combined effect of COVID-19 and the energy industry disruptions led to a decline in WTI crude oil prices of approximately 67 percent from the beginning of January 2020, when prices were approximately $62 per barrel, through the end of March 2020, when they were just above $20 per barrel. Overall crude oil price volatility has continued despite apparent agreement among OPEC+ regarding production cuts and as of June 17, 2020, the WTI price for a barrel of crude oil was approximately $38.
Despite a significant decline in drilling and completion activity by U.S. producers starting in mid-March 2020, domestic supply continues to exceed demand which has led to significant operational stress with respect to capacity limitations associated with storage, pipeline and refining infrastructure, particularly within the Gulf Coast region. The combined effect of the aforementioned factors is anticipated to have a continuing adverse impact on the industry in general and our operations specifically.
2019 Operational Highlights
Over the course of the year ended December 31, 2019, we:
• |
Placed in service, at the beginning of 2019, pressure pumping and related assets (510,000 HHP) acquired in connection with the Pioneer Pressure Pumping Acquisition, which resulted in an increase to our revenue and profitability in 2019; |
• |
Purchased 108,000 HHP of DuraStim® hydraulic fracturing pumps with the first DuraStim® pumps of 54,000 HHP delivered in December 2019, while the remaining hydraulic fracturing pumps or 54,000 HHP expected to be delivered in 2020;
|
• |
Entered into a purchase option agreement with our equipment supplier to purchase additional DuraStim® hydraulic fracturing pumps of 108,000 HHP;
|
• |
Maintained a high fleet utilization for the year 2019; and |
• |
Improved operational and financial processes by making changes to senior management in 2019. |
37
2019 Financial Highlights
Financial highlights for the year ended December 31, 2019:
• |
Revenue increased $347.8 million, or 20.4%, to $2,052.3 million, as compared to $1,704.6 million for the year ended December 31, 2018, primarily a result of the increase in our fleet size in connection with the Pioneer Pressure Pumping Acquisition placed in service at the beginning of 2019;
|
• |
Cost of services (exclusive of depreciation and amortization) increased $199.8 million or 15.7% to $1,470.4 million, as compared to $1,270.6 million for the year ended December 31, 2018, primarily a result of the increase in head count and higher activity levels resulting from the increase in fleet size. Cost of services as a percentage of revenue decreased to 71.6% in 2019 compared to 74.5% for the year ended December 31, 2018;
|
• |
General and administrative expenses, inclusive of stock-based compensation (“G&A”), increased $51.1 million, or 94.7% to $105.1 million, as compared to $54.0 million for the December 31, 2018. G&A as a percentage of revenue increased to 5.1% in 2019 from 3.2% for the year ended December 31, 2018. The increase was driven by increase in legal and professional fees, payroll related expense and net increase in other G&A expenses resulting partly from the expansion of our business with the Pioneer Pressure Pumping Acquisition. Included in G&A was approximately $24.2 million related to legal and professional fees incurred in connection with the Audit Committee internal review;
|
• |
Net income was $163.0 million, compared to $173.9 million for the December 31, 2018. Diluted net income per common share was $1.57, compared to $2.00 for the year ended December 31, 2018. Adjusted EBIDTA was approximately $519.1 million, compared to $388.5 million for the year ended December 31, 2018 (see reconciliation of Adjusted EBITDA to net income in the subsequent section “How We Evaluate Our Operations”); and
|
• |
Maintained a conservative balance sheet and sufficient liquidity. |
Actions to Address the Economic Impact of COVID-19 and Decline in Commodity Prices
Since March 2020, we initiated several actions to mitigate the anticipated adverse economic conditions for the immediate future and to support our financial position, liquidity and the efficient continuity of our operations as follows:
◦ |
Growth Capital. We cancelled substantially all our planned growth capital expenditures for the remainder of 2020.
|
◦ |
Other Expenditures. We significantly reduced our maintenance expenditures and field level consumable costs due to our reduced activity levels. We have been seeking lower pricing for our expendable items, materials used in day-to-day operations and large component replacement parts. Also, we have been internalizing certain support services that were outsourced.
|
◦ |
Labor Force Reductions. We have reduced our workforce by over 60% due to the changing activity levels for our services. We will continue to make appropriate adjustments to our workforce to reflect outlook related to activity levels.
|
◦ |
Compensation Related Costs. The directors and officers have voluntarily reduced compensation at different levels up to 20%. We have taken efforts to manage work schedules, primarily related to hourly employees, to minimize overtime costs.
|
◦ |
Working Capital. We have negotiated more favorable payment terms with certain of our larger vendors and are continuing to increase our diligence in collecting and managing our portfolio of accounts receivables.
|
We are continuing to evaluate and consider additional cost saving measures. We will continue to prioritize the safety and welfare of our employees and customers through these turbulent times.
38
Our Assets and Operations
Through our pressure pumping segment, which includes cementing operations, we primarily provide hydraulic fracturing services to E&P companies in the Permian Basin. Our modern hydraulic fracturing fleets have been designed to handle Permian Basin specific operating conditions and the region’s increasingly high‑intensity well completions, which are characterized by longer horizontal wellbores, more frac stages per lateral and increasing amounts of proppant per well. We continually reinvest in our equipment to ensure optimal performance and reliability.
In addition to our core pressure pumping segment operations, we also offer a suite of complementary well completion and production services, including coiled tubing and other services. We believe these complementary services create operational efficiencies for our customers and could allow us to capture a greater portion of their capital spending across the lifecycle of a well in the future.
How We Generate Revenue
We generate revenue primarily through our pressure pumping segment, and more specifically, by providing hydraulic fracturing services to our customers. We own and operate a fleet of mobile hydraulic fracturing units and other auxiliary equipment to perform fracturing services. We also provide personnel and services that are tailored to meet each of our customers’ needs. We charge our customers on a per‑job basis, in which we set pricing terms after receiving full specifications for the requested job, including the lateral length of the customer’s wellbore, the number of frac stages per well, the amount of proppant and chemicals to be used and other parameters of the job. We also could generate revenue from idle fees from Pioneer in certain circumstances.
In addition to hydraulic fracturing services, we generate revenue through the complementary services that we provide to our customers, including cementing, coiled tubing and other services. These complementary services are provided through various contractual arrangements, including on a turnkey contract basis, in which we set a price to perform a particular job, or a daywork contract basis, in which we are paid a set price per day for our services. We are also sometimes paid by the hour for these complementary services.
Our revenue, profitability and cash flows are highly dependent upon prevailing crude oil prices and expectations about future prices. For many years, oil prices and markets have been extremely volatile. Prices are affected by many factors beyond our control. WTI oil prices declined significantly in 2015 and 2016 to approximately $30 per barrel, but subsequently recovered in 2017 and 2018. However, in 2019, oil and natural gas prices were highly volatile. The average WTI oil price per barrel was approximately $57, $65 and $51 for the years ended December 31, 2019, 2018 and 2017, respectively. Demand for our services is largely dependent on oil and natural gas prices, and our customers’ completion budgets and rig count. In March 2020, WTI oil prices declined significantly, to a low of approximately $20 per barrel towards the end of March 2020. On June 17, 2020 the WTI oil price was approximately $38 per barrel. If such depressed prices continue or do not improve, demand for our services will be negatively impacted and result in a significant decrease in our profitability and cash flows. We monitor the oil and natural gas prices and the Permian Basin rig count to enable us to more effectively plan our business and forecast the demand for our services.
The historical weekly average Permian Basin rig count based on the Baker Hughes Incorporated rig count information were as follows:
Year Ended December 31, |
||||||||
Drilling Type (Permian Basin) |
2019 |
2018 |
2017 |
|||||
Directional |
5 |
6 |
6 |
|||||
Horizontal |
405 |
418 |
311 |
|||||
Vertical |
32 |
43 |
39 |
|||||
Total |
442 |
467 |
356 |
|||||
Average Permian Basin rig count to U.S rig count |
46.9 |
% |
45.2 |
% |
40.6 |
% |
||
39
Costs of Conducting our Business
The principal direct costs involved in operating our business are direct labor, expendables and other direct costs.
Direct Labor Costs. Payroll and benefit expenses related to our crews and other employees that are directly attributable to the effective delivery of services are included in our operating costs. Direct labor costs amounted to 19.6% and 13.1% of total costs of service for the years ended December 31, 2019 and 2018, respectively. The percentage increase in our direct labor costs was driven primarily by the increase in the crew costs and also the increase in the number of our customers directly sourcing certain expendables like sand and chemical, as discussed below, which has the effect of reducing our revenues.
Expendables. Expendables include the product and freight costs associated with proppant, chemicals and other consumables used in our pressure pumping and other operations. These costs comprise a substantial variable component of our service costs, particularly with respect to the quantity and quality of sand and chemicals demanded when providing hydraulic fracturing services. Expendable product costs comprised approximately 40.8%, and 56.0% of total costs of service for the years ended December 31, 2019 and 2018, respectively. The percentage decrease in our expendable product cost in 2019 is primarily attributable to the increase in the number of customers sourcing these expendables directly from the vendors and an increase in the use of less expensive regional sand, and overall depressed sand prices, which has the effect of reducing our revenues.
Other Direct Costs. We incur other direct expenses related to our service offerings, including the costs of fuel, repairs and maintenance, general supplies, equipment rental and other miscellaneous operating expenses. Fuel is consumed both in the operation and movement of our hydraulic fracturing fleet and other equipment. Repairs and maintenance costs are expenses directly related to upkeep of equipment, which have been amplified by the demand for higher horsepower jobs. Capital expenditures to upgrade or extend the useful life of equipment are not included in other direct costs. Other direct costs were 39.6% and 30.9% of total costs of service for the years ended December 31, 2019 and 2018, respectively. The percentage increase in our other direct costs was primarily a result of the increase in the number of our customers directly sourcing certain expendables like sand and chemical, as discussed above, which has the effect of reducing our revenues.
How We Evaluate Our Operations
Our management uses a variety of financial metrics, Adjusted EBITDA or Adjusted EBITDA margin to evaluate and analyze the performance of our various operating segments.
Adjusted EBITDA and Adjusted EBITDA Margin
We view Adjusted EBITDA and Adjusted EBITDA margin as important indicators of performance. We define EBITDA as our earnings, before (i) interest expense, (ii) income taxes and (iii) depreciation and amortization. We define Adjusted EBITDA as EBITDA, plus (i) loss/(gain) on disposal of assets, (ii) loss/(gain) on extinguishment of debt, (iii) stock-based compensation, and (iv) other unusual or non‑recurring (income)/expenses, such as impairment charges, severance, costs related to our IPO and costs related to asset acquisitions or one-time professional fees. Adjusted EBITDA margin reflects our Adjusted EBITDA as a percentage of our revenues.
Adjusted EBITDA and Adjusted EBITDA margin are supplemental measures utilized by our management and other users of our financial statements such as investors, commercial banks, and research analysts, to assess our financial performance because it allows us and other users to compare our operating performance on a consistent basis across periods by removing the effects of our capital structure (such as varying levels of interest expense), asset base (such as depreciation and amortization), nonrecurring (income) expenses and items outside the control of our management team (such as income taxes). Adjusted EBITDA and Adjusted EBITDA margin have limitations as analytical tools and should not be considered as an alternative to net income (loss), operating income (loss), cash flow from operating activities or any other measure of financial performance presented in accordance with generally accepted accounting principles in the United States of America (“GAAP”).
40
Note Regarding Non‑GAAP Financial Measures
Adjusted EBITDA and Adjusted EBITDA margin are not financial measures presented in accordance with GAAP (“non-GAAP”), except when specifically required to be disclosed by GAAP in the financial statements. We believe that the presentation of Adjusted EBITDA and Adjusted EBITDA margin provide useful information to investors in assessing our financial condition and results of operations because it allows them to compare our operating performance on a consistent basis across periods by removing the effects of our capital structure, asset base, nonrecurring (income) expenses and items outside the control of the Company. Net income (loss) is the GAAP measure most directly comparable to Adjusted EBITDA. Adjusted EBITDA and Adjusted EBITDA margin should not be considered as alternatives to the most directly comparable GAAP financial measure. Each of these non-GAAP financial measures has important limitations as analytical tools because they exclude some, but not all, items that affect the most directly comparable GAAP financial measures. You should not consider Adjusted EBITDA and Adjusted EBITDA margin in isolation or as a substitute for an analysis of our results as reported under GAAP. Because Adjusted EBITDA and Adjusted EBITDA margin may be defined differently by other companies in our industry, our definitions of these non-GAAP financial measures may not be comparable to similarly titled measures of other companies, thereby diminishing their utility.
Reconciliation of net income (loss) to Adjusted EBITDA ($ in thousands):
Pressure Pumping |
All Other |
Total |
|||||||||
Year ended December 31, 2019 |
|||||||||||
Net income (loss) |
$ |
281,090 |
$ |
(118,080 |
) |
$ |
163,010 |
||||
Depreciation and amortization |
139,348 |
5,956 |
145,304 |
||||||||
Interest expense |
51 |
7,090 |
7,141 |
||||||||
Income tax expense |
— |
50,494 |
50,494 |
||||||||
Loss on disposal of assets |
106,178 |
633 |
106,811 |
||||||||
Impairment expense |
— |
3,405 |
3,405 |
||||||||
Stock‑based compensation |
— |
7,776 |
7,776 |
||||||||
Other expense |
— |
717 |
717 |
||||||||
Other general and administrative expense (1)
|
— |
25,208 |
25,208 |
||||||||
Deferred IPO bonus, retention bonus and severance expense |
7,093 |
2,110 |
9,203 |
||||||||
Adjusted EBITDA |
$ |
533,760 |
$ |
(14,691 |
) |
$ |
519,069 |
||||
41
Pressure Pumping |
All Other |
Total |
|||||||||
Year ended December 31, 2018 |
|||||||||||
Net income (loss) |
$ |
253,196 |
$ |
(79,334 |
) |
$ |
173,862 |
||||
Depreciation and amortization |
83,404 |
4,734 |
88,138 |
||||||||
Interest expense |
— |
6,889 |
6,889 |
||||||||
Income tax expense |
— |
51,255 |
51,255 |
||||||||
Loss (gain) on disposal of assets |
59,962 |
(742 |
) |
59,220 |
|||||||
Stock‑based compensation |
— |
5,482 |
5,482 |
||||||||
Other expense |
— |
663 |
663 |
||||||||
Other general and administrative expense (1)
|
2 |
203 |
205 |
||||||||
Deferred IPO bonus |
1,832 |
977 |
2,809 |
||||||||
Adjusted EBITDA |
$ |
398,396 |
$ |
(9,873 |
) |
$ |
388,523 |
||||
Pressure Pumping |
All Other |
Total |
|||||||||
Year ended December 31, 2017 |
|||||||||||
Net income (loss) |
$ |
50,417 |
$ |
(37,804 |
) |
$ |
12,613 |
||||
Depreciation and amortization |
51,155 |
4,473 |
55,628 |
||||||||
Interest expense |
— |
7,347 |
7,347 |
||||||||
Income tax expense |
— |
3,128 |
3,128 |
||||||||
Loss on disposal of assets |
38,059 |
1,027 |
39,086 |
||||||||
Stock‑based compensation |
— |
9,489 |
9,489 |
||||||||
Other expense |
— |
1,025 |
1,025 |
||||||||
Other general and administrative expense (1)
|
— |
722 |
722 |
||||||||
Deferred IPO bonus |
5,491 |
2,914 |
8,405 |
||||||||
Adjusted EBITDA |
$ |
145,122 |
$ |
(7,679 |
) |
$ |
137,443 |
||||
____________________
(1) |
Other general and administrative expense primarily relates to nonrecurring professional fees paid to external consultants in connection with the Expanded Audit Committee Review and advisory services in 2019, and legal settlements in 2018 and 2017. |
42
Results of Operations
We conduct our business through five operating segments: hydraulic fracturing, cementing, coiled tubing, flowback and drilling. For reporting purposes, the hydraulic fracturing and cementing operating segments are aggregated into our one reportable segment, pressure pumping. The comparability of the results of operations may have been impacted by the Pioneer Pressure Pumping Acquisition which was consummated on December 31, 2018. The acquisition cost of the assets was comprised of approximately $110.0 million of cash and 16.6 million shares of our common stock. In addition, we entered into a real estate lease for a crew camp facility with Pioneer. The real estate lease for the crew camp was terminated in July 2019. In connection with the consummation of the transaction, we became a long-term service provider to Pioneer, providing pressure pumping and related services for a term of up to ten years. The Pioneer Pressure Pumping Acquisition resulted in an additional 510,000 HHP being deployed at the beginning of 2019.
Year Ended December 31, 2019 Compared to Year Ended December 31, 2018
($ in thousands, except percentages) |
|||||||||||||||
Year Ended December 31, |
Change |
||||||||||||||
2019 |
2018 |
Variance |
% |
||||||||||||
Revenue |
$ |
2,052,314 |
$ |
1,704,562 |
$ |
347,752 |
20.4 |
% |
|||||||
Less (Add): |
|||||||||||||||
Cost of services (1)
|
1,470,356 |
1,270,577 |
199,779 |
15.7 |
% |
||||||||||
General and administrative expense (2)
|
105,076 |
53,958 |
51,118 |
94.7 |
% |
||||||||||
Depreciation and amortization |
145,304 |
88,138 |
57,166 |
64.9 |
% |
||||||||||
Impairment expense |
3,405 |
— |
3,405 |
100.0 |
% |
||||||||||
Loss on disposal of assets |
106,811 |
59,220 |
47,591 |
80.4 |
% |
||||||||||
Interest expense |
7,141 |
6,889 |
252 |
3.7 |
% |
||||||||||
Other expense |
717 |
663 |
54 |
8.1 |
% |
||||||||||
Income tax expense |
50,494 |
51,255 |
(761 |
) |
(1.5 |
)% |
|||||||||
Net income |
$ |
163,010 |
$ |
173,862 |
$ |
(10,852 |
) |
(6.2 |
)% |
||||||
Adjusted EBITDA (3)
|
$ |
519,069 |
$ |
388,523 |
$ |
130,546 |
33.6 |
% |
|||||||
Adjusted EBITDA Margin (3)
|
25.3 |
% |
22.8 |
% |
2.5 |
% |
11.0 |
% |
|||||||
Pressure pumping segment results of operations: |
|||||||||||||||
Revenue |
$ |
2,001,627 |
$ |
1,658,403 |
$ |
343,224 |
20.7 |
% |
|||||||
Cost of services |
$ |
1,428,620 |
$ |
1,236,262 |
$ |
192,358 |
15.6 |
% |
|||||||
Adjusted EBITDA |
$ |
533,760 |
$ |
398,396 |
$ |
135,364 |
34.0 |
% |
|||||||
Adjusted EBITDA Margin (4)
|
26.7 |
% |
24.0 |
% |
2.7 |
% |
11.3 |
% |
|||||||
(1) |
Exclusive of depreciation and amortization. |
(2) |
Inclusive of stock‑based compensation of $7.8 million and $5.5 million for 2019 and 2018, respectively.
|
(3) |
For definitions of the non‑GAAP financial measures of Adjusted EBITDA and Adjusted EBITDA margin and reconciliation of Adjusted EBITDA and Adjusted EBITDA margin to our most directly comparable financial measures calculated in accordance with GAAP, please read “How We Evaluate Our Operations”. |
(4) |
The non‑GAAP financial measure of Adjusted EBITDA margin for the pressure pumping segment is calculated by taking Adjusted EBITDA for the pressure pumping segment as a percentage of our revenues for the pressure pumping segment. |
43
Revenue. Revenue increased 20.4%, or $347.8 million, to $2,052.3 million for the year ended December 31, 2019, as compared to $1,704.6 million for the year ended December 31, 2018. The increase was primarily attributable to the increase in our effectively utilized fleets from approximately 18.8 active fleets in 2018 to 23.9 in 2019, and an increase in demand for our pressure pumping services and certain customer activity, specifically driven by the Pioneer Pressure Pumping Acquisition. The increase in revenue was partly offset by the increase in the number of customers self-sourcing certain consumables like sand. Our pressure pumping segment revenues increased 20.7%, or $343.2 million for the year ended December 31, 2019, as compared to the year ended December 31, 2018.
Revenues from services other than pressure pumping increased 9.8%, or approximately $4.5 million, for the year ended December 31, 2019, as compared to the year ended December 31, 2018. The increase in revenues from services other than pressure pumping during the year ended December 31, 2019, was primarily attributable to the increase in demand for our coiled tubing services.
Cost of Services. Cost of services increased 15.7%, or $199.8 million, to $1,470.4 million for the year ended December 31, 2019, from $1,270.6 million during the year ended December 31, 2018. Cost of services in our pressure pumping segment increased $192.4 million during the year ended December 31, 2019, as compared to the year ended December 31, 2018. The increases were primarily attributable to higher activity levels, coupled with an increase in personnel headcount following the increase in our operations in connection with the Pioneer Pressure Pumping Acquisition. As a percentage of pressure pumping segment revenues, pressure pumping cost of services decreased to 71.4% for the year ended December 31, 2019, as compared to 74.5% for the year ended December 31, 2018. The decrease in cost of services as a percentage of revenue in our pressure pumping segment is attributed to the increased revenue from operational efficiencies and a favorable change in our cost structure driven by our internal cost control initiatives, a decrease in the cost of certain consumables and an increase in the number of customers self-sourcing sand and other consumables, which resulted in significantly higher realized Adjusted EBITDA margins during the year ended December 31, 2019.
General and Administrative Expenses. General and administrative expenses increased 94.7%, or $51.1 million, to $105.1 million for the year ended December 31, 2019, as compared to $54.0 million for the year ended December 31, 2018. The net increase was primarily attributable to the increase in retention bonuses, stock-based compensation, and severance and related expenses of $11.0 million driven primarily by the increase in personnel following the Pioneer Pressure Pumping Acquisition, increase in nonrecurring professional fees of $25.0 million, primarily in connection with the Expanded Audit Committee Review, and net increase in our remaining other general and administrative expenses of approximately $15.1 million.
Depreciation and Amortization. Depreciation and amortization increased 64.9%, or $57.2 million, to $145.3 million for the year ended December 31, 2019, as compared to $88.1 million for the year ended December 31, 2018. The increase was primarily attributable to additional property and equipment purchased in connection with the Pioneer Pressure Pumping Acquisition and other equipment put into service during the year ended December 31, 2019.
Impairment Expense. Impairment expense of $3.4 million, a non-cash expense, was recorded during the year ended December 31, 2019 in connection with our vertical drilling rigs and flowback assets resulting from the depressed demand and negative future near-term outlook for our drilling assets and the shutdown of our flowback operations. No impairment expense was recorded in the year ended December 31, 2018.
Loss on Disposal of Assets. Loss on the disposal of assets increased 80.4%, or $47.6 million, to $106.8 million for the year ended December 31, 2019, as compared to $59.2 million for the year ended December 31, 2018. The increase was primarily attributable to an increase in our hydraulic fracturing fleet size, and greater intensity of jobs as well as the number of jobs completed. Upon sale or retirement of property and equipment, including certain major components like fluid ends and power ends of our pressure pumping equipment that are replaced, the cost and related accumulated depreciation are removed from the balance sheet and the net amount is recognized as loss on disposal of assets.
44
Interest Expense. Interest expense increased 3.7%, or $0.3 million, to $7.1 million for the year ended December 31, 2019, as compared to $6.9 million for the year ended December 31, 2018. The increase in interest expense was primarily attributable to an increase in our average debt balance in 2019 compared to 2018.
Other Expense. Other expense was relatively flat at $0.7 million for the year ended December 31, 2019, similar to $0.7 million for the year ended December 31, 2018.
Income Tax Expense. Income tax expense was $50.5 million for the year ended December 31, 2019, as compared to $51.3 million for the year ended December 31, 2018. The slight decrease in our provision for income tax expense is attributable to the decrease in pre-tax book income in 2019 compared to 2018. Our effective tax rate was relatively flat at 23.7% during the year ended December 31, 2019 compared to 22.8% during the year ended December 31, 2018.
Liquidity and Capital Resources
Our liquidity is currently provided by (i) existing cash balances, (ii) operating cash flows and (iii) borrowings under our revolving credit facility (“ABL Credit Facility”). Our primary uses of cash will be to continue to fund our operations, support growth opportunities and satisfy debt payments. Our borrowing base, as redetermined monthly, is tied to 85.0% of eligible accounts receivable. Our borrowing base as of December 31, 2019 was approximately $181.2 million and was approximately $16.8 million as of June 19, 2020. Changes to our operational activity levels have an impact on our total eligible accounts receivable, which could result in significant changes to our borrowing base and therefore our availability under our ABL Credit Facility. With the current depressed oil and gas market conditions, we believe our remaining monthly availability under our ABL Credit facility will be adversely impacted by the expected decline in our customers’ activity.
As of December 31, 2019, our borrowings under our ABL Credit Facility was $130.0 million and our total liquidity was $198.7 million, consisting of cash and cash equivalents of $149.0 million and $49.7 million of availability under our ABL Credit Facility.
As of June 19, 2020, we had no borrowings under our ABL Credit Facility and our total liquidity was approximately $57.4 million, consisting of cash and cash equivalents of $42.2 million and $15.2 million of availability under our ABL Credit Facility.
There can be no assurance that operations and other capital resources will provide cash in sufficient amounts to maintain planned or future levels of capital expenditures. Future cash flows are subject to a number of variables, and are highly dependent on the drilling, completion, and production activity by our customers, which in turn is highly dependent on oil and natural gas prices. Depending upon market conditions and other factors, we may issue equity and debt securities or take other actions necessary to fund our business or meet our future long-term liquidity requirements.
The global public health crisis associated with the COVID-19 pandemic has and is anticipated to continue to have an adverse effect on global economic activity for the immediate future and has resulted in travel restrictions, business closures and the institution of quarantining and other restrictions on movement in many communities. The slowdown in global economic activity attributable to COVID-19 has resulted in a dramatic decline in the demand for energy which directly impacts our industry and the Company. In addition, global crude oil prices experienced a collapse starting in early March 2020. As a result of these developments, the Company expects a material adverse impact on the oil field services we provide and our revenue, results of operations and cash flows. These situations are rapidly changing and additional impacts to the business may arise that we are not aware of currently and the depressed oil and gas industry may take a longer time to recover thereby significantly impacting on revenue, results of operations and cash flows for a longer period of time.
45
Cash and Cash Flows
The following table sets forth our net cash provided by (used in) operating, investing and financing activities during the years ended December 31, 2019, 2018 and 2017, respectively.
Year Ended December 31, |
|||||||||||
($ in thousands) |
2019 |
2018 |
2017 |
||||||||
Net cash provided by operating activities |
$ |
455,290 |
$ |
393,079 |
$ |
109,257 |
|||||
Net cash used in investing activities |
$ |
(495,299 |
) |
$ |
(280,604 |
) |
$ |
(281,469 |
) |
||
Net cash provided by (used in) financing activities |
$ |
56,345 |
$ |
(3,724 |
) |
$ |
62,565 |
||||
Operating Activities
Net cash provided by operating activities was $455.3 million for the year ended December 31, 2019, as compared to $393.1 million for the year ended December 31, 2018. The net increase of $62.2 million was primarily due to the expansion of our operations following the Pioneer Pressure Pumping Acquisition as well as the associated increase in revenue and cash operating profits, and also impacted by the timing of our receivable collections from our customers and payment to our vendors.
Investing Activities
Net cash used in investing activities increased to $495.3 million for the year ended December 31, 2019, from $280.6 million for the year ended December 31, 2018. The increase was primarily attributable to the cash payment of approximately $110.0 million in connection with the Pioneer Pressure Pumping Acquisition. In addition, during the year ended December 31, 2019, we paid approximately $145.3 million for 108,000 HHP of DuraStim® hydraulic fracturing units, ancillary equipment and turbines (including an option payment of $6.1 million to purchase an additional 108,000 HHP of DuraStim® fleets through the end of 2020). The remaining cash payments in 2019 were primarily incurred in connection with our maintenance capital expenditures and other growth initiatives.
Financing Activities
Net cash provided by financing activities was $56.3 million for the year ended December 31, 2019, compared to net cash used of $3.7 million for the year ended December 31, 2018. Our net cash provided by financing activities during the year ended December 31, 2019 was primarily driven by proceeds from borrowings of $110.0 million to fund our working capital needs and cash payment for fleets acquired in connection with the Pioneer Pressure Pumping Acquisition, proceeds from exercise of equity awards of $1.2 million which was partially offset by cash used in repayment of borrowings of $50.0 million, repayments of insurance financing of $4.5 million and finance lease payment of approximately $0.3 million. Our net cash used in financing activities during the year ended December 31, 2018 was primarily driven by repayment of borrowings of $80.9 million, repayment of insurance financing of $4.5 million, payment of debt issuance costs of $1.7 million, partially offset by proceeds from borrowings of $77.4 million to fund our working capital needs and proceeds from insurance financing of $5.8 million.
Future Sources and Use of Cash
Capital expenditures for 2020 are projected to be primarily related to maintenance capital expenditures to support our existing assets and growth initiatives, depending on market conditions. We anticipate our capital expenditures will be funded by existing cash, cash flows from operations, and if needed, borrowings under our ABL Credit Facility. Our maintenance capital expenditures are dependent on our operational activity and the intensity on the equipment, among other factors, which could vary throughout the year.
In addition, we have an agreement with our equipment manufacturer granting the Company the option to purchase additional DuraStim® hydraulic fracturing pumps of approximately 108,000 HHP with the purchase option expiring at different times through April 30, 2021. We believe the cost to acquire the DuraStim® pumps will be comparable to our previously purchased DuraStim® pumps. In the current economic environment it is not probable we would exercise these options.
46
We have repaid all our borrowings, as of June 19, 2020, under our ABL Credit Facility with cash flows from operations and our available cash. Our objective is to maintain a conservative leverage ratio. Through June 19, 2020, we repaid $130.0 million of our borrowings under the ABL Credit Facility.
Credit Facility and Other Financing Arrangements
ABL Credit Facility
Our ABL Credit Facility, as amended, has a total borrowing capacity of $300 million (subject to the Borrowing Base limit), with a maturity date of December 19, 2023. The ABL Credit Facility has a borrowing base of 85% of monthly eligible accounts receivable less customary reserves (the "Borrowing Base"). The Borrowing Base as of December 31, 2019 was approximately $181.2 million. The ABL Credit Facility includes a Springing Fixed Charge Coverage Ratio to apply when excess availability is less than the greater of (i) 10% of the lesser of the facility size or the Borrowing Base or (ii) $22.5 million. Under this facility we are required to comply, subject to certain exceptions and materiality qualifiers, with certain customary affirmative and negative covenants, including, but not limited to, covenants pertaining to our ability to incur liens, indebtedness, changes in the nature of our business, mergers and other fundamental changes, disposal of assets, investments and restricted payments, amendments to our organizational documents or accounting policies, prepayments of certain debt, dividends, transactions with affiliates, and certain other activities. Borrowings under the ABL Credit Facility are secured by a first priority lien and security interest in substantially all assets of the Company.
Borrowings under the ABL Credit Facility accrue interest based on a three-tier pricing grid tied to availability, and we may elect for loans to be based on either LIBOR or base rate, plus the applicable margin, which ranges from 1.75% to 2.25% for LIBOR loans and 0.75% to 1.25% for base rate loans, with a LIBOR floor of zero. The weighted average interest rate under our ABL Credit Facility for the year ended December 31, 2019 was 4.4%.
In March 2020, we obtained a waiver from our lenders under the ABL Credit Facility to extend the time period for us to provide our lenders the Company’s audited financial statements for the year ended December 31, 2019 to July 31, 2020.
Off Balance Sheet Arrangements
We had no off balance sheet arrangements as of December 31, 2019.
Capital Requirements
Capital expenditures incurred were $400.7 million during the year ended December 31, 2019, as compared to $592.6 million during the year ended December 31, 2018. The higher capital expense in 2018 was primarily attributable to the Pioneer Pressure Pumping Acquisition. We financed the Pioneer Pressure Pumping Acquisition with a combination of cash from operations and borrowings under our ABL Credit Facility and the issuance of 16.6 million of our common shares to Pioneer.
Contractual Obligations
The following table presents our contractual obligations and other commitments as of December 31, 2019.
($ in thousands) |
Payment Due by Period |
|||||||||||||||||||
Total |
Less than 1 year |
1 - 3 years |
3- 5 years |
More than 5 years |
||||||||||||||||
ABL Credit Facility (1)
|
$ |
130,000 |
$ |
— |
$ |
— |
$ |
130,000 |
$ |
— |
||||||||||
Operating leases(2)
|
1,230 |
366 |
766 |
98 |
— |
|||||||||||||||
Finance leases (2)
|
2,833 |
2,833 |
— |
— |
— |
|||||||||||||||
Other purchase obligation |
9,300 |
4,815 |
4,485 |
— |
— |
|||||||||||||||
Total |
$ |
143,363 |
$ |
8,014 |
$ |
5,251 |
$ |
130,098 |
$ |
— |
||||||||||
(1) |
Exclusive of future commitment fees, amortization of deferred financing costs, interest expense or other fees on our revolving credit facility because obligations thereunder are floating rate instruments and we cannot determine with accuracy the timing of future loan advances, repayments or future interest rates to be charged. However, assuming a weighted average interest rate of 4.4%, and that our ABL Credit Facility debt balance remains the same, our estimated annual interest payment will be $5.8 million.
|
(2) |
Finance and Operating leases include agreements for various office and yard locations, excluding short-term leases (see Note 17. Leases and Note 18. Commitments and Contingencies in the financial statements for additional disclosures, including estimated interest). |
47
The Company enters into purchase agreements with the Sand suppliers to secure supply of sand as part of its normal course of business. The agreements with the Sand suppliers require that the Company purchase a minimum volume of sand, constituting substantially all of its sand requirements, from the Sand suppliers, otherwise certain penalties may be charged. Under certain of the purchase agreements, a shortfall fee applies if the Company purchases less than the minimum volume of sand. The shortfall fee represents liquidated damages and is either a fixed percentage of the purchase price for the minimum volumes or a fixed price per ton of unpurchased volumes. Under one of the purchase agreements, the Company is obligated to purchase a specified percentage of its overall sand requirements, or it must pay the supplier the difference between the purchase price of the minimum volumes under the purchase agreement and the purchase price of the volumes actually purchased. Our minimum volume commitments under the purchase agreements are either based on a percentage of our total usage or fixed minimum quantity. Our agreements with the Sand suppliers expire at different times prior to April 30, 2022.
Recent Accounting Pronouncements
Disclosure concerning recently issued accounting standards is incorporated by reference to Note 2 of our Consolidated Financial Statements contained in this Annual Report.
Critical Accounting Policies and Estimates
The discussion and analysis of our financial condition and results of operations is based on our consolidated financial statements, which have been prepared in accordance with accounting principles generally acceptable in the United States of America. The preparation of these financial statements requires us to make estimates and assumptions that affect the reported amounts of assets and liabilities and the disclosure of contingent assets and liabilities at the dates of the financial statements and the reported revenues and expenses during the years. We evaluate these estimates and assumptions on an ongoing basis and base our estimates on historical experience, current conditions and various other assumptions that we believe to be reasonable under the circumstances. The results of these estimates form the basis for making judgments about the carrying values of assets and liabilities as well as identifying and assessing the accounting treatment with respect to commitments and contingencies. Our actual results may materially differ from these estimates.
Listed below are the accounting policies that we believe are critical to our financial statements due to the degree of uncertainty regarding the estimates or assumptions involved, and that we believe are critical to the understanding of our operations.
Property and Equipment
Our property and equipment are recorded at cost, less accumulated depreciation.
Upon sale or retirement of property and equipment, the cost and related accumulated depreciation are removed from the balance sheet and the net amount, less proceeds from disposal, is recognized as a gain or loss in earnings.
We primarily retired certain components of equipment such as fluid ends and power ends, rather than entire pieces of equipment, which resulted in a net loss on disposal of assets of $106.8 million, $59.2 million and $39.1 million for the years ended December 31, 2019, 2018 and 2017, respectively.
Depreciation of property and equipment is provided on the straight‑line method over estimated useful lives as shown in the table below. The estimated useful lives and salvage values of property and equipment is subject to key assumptions such as maintenance, utilization and job variation. Unanticipated future changes in these assumptions could negatively or positively impact our net income. A 10% change in the useful lives of our property and equipment would have resulted in approximately $14.5 million impact on pre-tax income during the year ended December 31, 2019.
48
Land |
Indefinite |
Buildings and property improvements |
5 - 30 years |
Vehicles |
1 ‑ 5 years |
Equipment |
1 ‑ 20 years |
Leasehold improvements |
5 ‑ 20 years |
Impairment of Long-Lived Assets
In accordance with the Financial Accounting Standards Board (“FASB”) Accounting Standards Codification (“ASC”) 360 regarding Accounting for the Impairment or Disposal of Long‑Lived Assets, we review the long‑lived assets to be held and used whenever events or circumstances indicate that the carrying value of those assets may not be recoverable. An impairment loss is indicated if the sum of the expected future undiscounted cash flows attributable to the assets is less than the carrying amount of such assets. In this circumstance, we recognize an impairment loss for the amount by which the carrying amount of the assets exceeds the estimated fair value of the asset. Our cash flow forecasts require us to make certain judgments regarding long‑term forecasts of future revenue and costs and cash flows related to the assets subject to review. The significant assumption in our cash flow forecasts is our estimated equipment utilization and profitability. The significant assumption is uncertain in that it is driven by future demand for our services and utilization which could be impacted by crude oil market prices, future market conditions and technological advancements. Our fair value estimates for certain long‑lived assets require us to use significant other observable inputs, including significant assumptions related to market approach based on recent auction sales or selling prices of comparable equipment. The estimates of fair value are also subject to significant variability, are sensitive to changes in market conditions, and are reasonably likely to change in the future. We recorded an impairment loss of $1.2 million during the year ended December 31, 2019 related to our drilling assets group, because we believe that our cash flow forecasts were negatively impacted by the depressed vertical drilling market, which led to the idling of the drilling rigs. Based on observable market inputs, we believe the fair value of the drilling rigs have declined following the continued market decline in the demand for vertical drilling services. In addition, we recorded an impairment loss of $2.2 million related to our flowback assets group because we believe our future cash flow forecasts were negatively impacted by the decline in the demand for our flowback services and the general depressed market for flowback operations.
If the crude oil market declines or the demand for vertical drilling does not recover, and if the equipment remains idle or under‑utilized, the estimated fair value of such equipment may decline, which could result in future impairment charges. Though the impacts of variations in any of these factors can have compounding or off‑setting impacts, a 10% decline in the estimated fair value of our drilling assets at December 31, 2019 would result in additional impairment of $0.2 million.
During the first quarter of 2020, management determined the reductions in commodity prices driven by the potential impact of the novel COVID-19 virus and global supply and demand dynamics coupled with the sustained decrease in the Company’s share price were triggering events for asset impairment. As a result of the triggering events, we performed recoverability tests on each of the assets groups. As a result, we expect to recognize impairments and charges in the first quarter of 2020 as follows:
• |
drilling asset group impairment of approximately $1.1 million as a result of our recoverability tests; and |
• |
write-off of $6.1 million of deposits related to options to purchase additional DuraStim® equipment for which options expire at various times through the end of April 2021 as it is not probable we would exercise our options due to the events described above.
|
Goodwill
Goodwill is the excess of the consideration transferred over the fair value of the tangible and identifiable intangible assets and liabilities recognized. Goodwill is not amortized. We perform an annual impairment test of goodwill as of December 31, or more frequently if circumstances indicate that impairment may exist.
49
There were no additions to, or disposal of, goodwill during the year ended December 31, 2019. We performed our annual goodwill impairment test in accordance with ASC 350, Intangibles—Goodwill and Other, on December 31, 2019, at which time, we determined that the fair value of our hydraulic fracturing reporting unit was substantially in excess of its carrying value. The hydraulic fracturing operating segment is the only segment which has goodwill at December 31, 2019. The quantitative impairment test we perform for goodwill utilizes certain assumptions, including forecasted active fleet revenue and cost assumptions. Our discounted cash flow analysis includes significant assumptions regarding discount rates, fleet utilization, expected profitability margin, forecasted maintenance capital expenditures, the timing of an anticipated market recovery, and the timing of expected cash flow. As such, this analysis incorporates inherent uncertainties that are difficult to predict in volatile economic environments and could result in impairment charges in future periods if actual results materially differ from the estimated assumptions utilized in our forecast. In March 2020, crude oil prices declined significantly, an indication that a triggering event has occurred, and as such, we expect to record a goodwill impairment expense of up to $9.4 million during the first quarter of 2020.
Income Taxes
Income taxes are accounted for under the asset and liability method, which requires the recognition of deferred tax assets and liabilities for the expected future tax consequences of events that have been included in the consolidated financial statements. Under this method, deferred tax assets and liabilities are determined on the basis of differences between the consolidated financial statements and tax bases of assets and liabilities using enacted tax rates in effect for the year in which the differences are expected to reverse. The effect of a change in tax rates on deferred tax assets and liabilities is recognized in income in the period that includes the enactment date.
We recognize deferred tax assets to the extent that we believe these assets are more likely than not to be realized. In making such a determination, we consider all positive and negative evidence, including future reversals of existing taxable temporary differences, projected future taxable income, and the results of recent operations. If we determine that we would not be able to fully realize our deferred tax assets in the future in excess of their net recorded amount, we would record a valuation allowance, which would increase our provision for income taxes. In determining our need for a valuation allowance as of December 31, 2019, we have considered and made judgments and estimates regarding estimated future taxable income. These estimates and judgments include some degree of uncertainty and changes in these estimates and assumptions could require us to record a valuation allowances for our deferred tax assets and the ultimate realization of tax assets depends on the generation of sufficient taxable income.
Our methodology for recording income taxes requires a significant amount of judgment in the use of assumptions and estimates. Additionally, we forecast certain tax elements, such as future taxable income, as well as evaluate the feasibility of implementing tax planning strategies. Given the inherent uncertainty involved with the use of such variables, there can be significant variation between anticipated and actual results. Unforeseen events may significantly impact these variables, and changes to these variables could have a material impact on our income tax accounts. The final determination of our income tax liabilities involves the interpretation of local tax laws and related authorities in each jurisdiction. Changes in the operating environments, including changes in tax law, could impact the determination of our income tax liabilities for a tax year.
50
Item 7A. Quantitative and Qualitative Disclosure of Market Risks
Foreign Currency Exchange Risk
Our operations are currently conducted entirely within the U.S; therefore, we had no significant exposure to foreign currency exchange risk in 2019.
Commodity Price Risk
Our material and fuel purchases expose us to commodity price risk. Our material costs primarily include the cost of inventory consumed while performing our pressure pumping services such as proppants, chemicals, guar, trucking and fluid supplies. Our fuel costs consist primarily of diesel and natural gas used by our various trucks and other motorized equipment. The prices for fuel and materials in our inventory are volatile and are impacted by changes in supply and demand, as well as market uncertainty and regional shortages. Historically, we have generally been able to pass along price increases to our customers; however, we may be unable to do so in the future. We do not engage in commodity price hedging activities.
Interest Rate Risk
We may be subject to interest rate risk on variable rate debt under our ABL Credit Facility. We do not currently engage in interest rate derivatives to hedge our interest rate risk. The impact of a 1% increase in interest rates on our variable rate debt would have resulted in an increase in interest expense and corresponding decrease in pre‑tax income of approximately $1.3 million, $0.7 million and $0.2 million, for the years ended December 31, 2019, 2018 and 2017, respectively.
Credit Risk
Financial instruments that potentially subject us to concentrations of credit risk are trade receivables. We extend credit to customers and other parties in the normal course of business. We have established various procedures to manage our credit exposure, including maintaining an allowance for doubtful accounts.
51
Item 8. Financial Statements and Supplementary Data.
REPORT OF INDEPENDENT REGISTERED PUBLIC ACCOUNTING FIRM
To the Shareholders and the Board of Directors of
ProPetro Holding Corp. and Subsidiary
Opinion on the Financial Statements
We have audited the accompanying consolidated balance sheets of ProPetro Holding Corp. and Subsidiary (the "Company") as of December 31, 2019 and 2018, the related consolidated statements of operations, shareholders' equity and cash flows, for each of the three years in the period ended December 31, 2019, and the related notes (collectively referred to as the "financial statements"). In our opinion, the financial statements present fairly, in all material respects, the financial position of the Company as of December 31, 2019 and 2018, and the results of its operations and its cash flows for each of the three years in the period ended December 31, 2019, in conformity with, accounting principles generally accepted in the United States of America.
We have also audited, in accordance with the standards of the Public Company Accounting Oversight Board (United States) (PCAOB), the Company's internal control over financial reporting as of December 31, 2019, based on criteria established in Internal Control - Integrated Framework (2013) issued by the Committee of Sponsoring Organizations of the Treadway Commission and our report dated June 19, 2020, expressed an adverse opinion on the Company's internal control over financial reporting.
Basis for Opinion
These financial statements are the responsibility of the Company's management. Our responsibility is to express an opinion on the Company's financial statements based on our audits. We are a public accounting firm registered with the PCAOB and are required to be independent with respect to the Company in accordance with the U.S. federal securities laws and the applicable rules and regulations of the Securities and Exchange Commission and the PCAOB.
We conducted our audits in accordance with the standards of the PCAOB. Those standards require that we plan and perform the audit to obtain reasonable assurance about whether the financial statements are free of material misstatement, whether due to error or fraud. Our audits included performing procedures to assess the risks of material misstatement of the financial statements, whether due to error or fraud, and performing procedures that respond to those risks. Such procedures included examining, on a test basis, evidence regarding the amounts and disclosures in the financial statements. Our audits also included evaluating the accounting principles used and significant estimates made by management, as well as evaluating the overall presentation of the financial statements. We believe that our audits provide a reasonable basis for our opinion.
Critical Audit Matters
The critical audit matters communicated below are matters arising from the current-period audit of the financial statements that were communicated or required to be communicated to the audit committee and that (1) relate to accounts or disclosures that are material to the financial statements and (2) involved our especially challenging, subjective, or complex judgments. The communication of critical audit matters does not alter in any way our opinion on the financial statements, taken as a whole, and we are not, by communicating the critical audit matters below, providing separate opinions on the critical audit matters or on the accounts or disclosures to which they relate.
Related-party transactions — Refer to Note 16 to the financial statements
Critical Audit Matter Description
The Company engages in related party transactions, such as leasing of its corporate office, drilling yards, renting of equipment, purchasing assets, and providing pressure pumping and related services.
We identified related-party transactions as a critical audit matter because of the Company’s lack of effective controls related to the identification and approval of transactions involving related parties or potential conflicts of interest, including the material weaknesses discussed in Management’s Report on Internal Control over Financial Reporting. The heightened risk that related-party transactions were not timely identified and properly disclosed by the Company in the
52
financial statements required us to exercise significant auditor judgment when performing audit procedures on related-party transactions.
How the Critical Audit Matter Was Addressed in the Audit
Our audit procedures for related-party transactions included the following, among others:
• |
We evaluated the completeness of related-party transactions by obtaining the Company’s list of related-party relationships and transactions and performing the following: |
– |
Comparing it to public filings, external news, third-party information or research reports, selected vendor and customer websites, questionnaires completed by the Company’s directors and officers, and other sources. |
– |
Searching for potential related-party transactions within the accounts receivable, accounts payable, and vendor listings master files and journal entries by searching for the name, vendor identification numbers, and customer identification numbers of the related parties. |
– |
Inspecting the Company’s minutes from meetings of the Board of Directors and related committees. |
– |
Making inquiries of executive officers, key members of management, and the Audit Committee of the Board of Directors regarding related party transactions. |
/s/ DELOITTE & TOUCHE LLP
Houston, Texas
June 19, 2020
We have served as the Company's auditor since 2013.
53
REPORT OF INDEPENDENT REGISTERED PUBLIC ACCOUNTING FIRM
To the Shareholders and the Board of Directors of
ProPetro Holding Corp. and Subsidiary
Opinion on Internal Control over Financial Reporting
We have audited the internal control over financial reporting of ProPetro Holding Corp. and Subsidiary (the “Company”) as of December 31, 2019, based on criteria established in Internal Control - Integrated Framework (2013) issued by the Committee of Sponsoring Organizations of the Treadway Commission (COSO). In our opinion, because of the effect of the material weaknesses identified below on the achievement of the objectives of the control criteria, the Company has not maintained effective internal control over financial reporting as of December 31, 2019, based on criteria established in Internal Control - Integrated Framework (2013) issued by COSO.
We have also audited, in accordance with the standards of the Public Company Accounting Oversight Board (United States) (PCAOB), the consolidated financial statements as of and for the year ended December 31, 2019, of the Company and our report dated June 19, 2020, expressed an unqualified opinion on those financial statements.
Basis for Opinion
The Company’s management is responsible for maintaining effective internal control over financial reporting and for its assessment of the effectiveness of internal control over financial reporting, included in the accompanying Management’s Report on Internal Control Over Financial Reporting. Our responsibility is to express an opinion on the Company’s internal control over financial reporting based on our audit. We are a public accounting firm registered with the PCAOB and are required to be independent with respect to the Company in accordance with the U.S. federal securities laws and the applicable rules and regulations of the Securities and Exchange Commission and the PCAOB.
We conducted our audit in accordance with the standards of the PCAOB. Those standards require that we plan and perform the audit to obtain reasonable assurance about whether effective internal control over financial reporting was maintained in all material respects. Our audit included obtaining an understanding of internal control over financial reporting, assessing the risk that a material weakness exists, testing and evaluating the design and operating effectiveness of internal control based on the assessed risk, and performing such other procedures as we considered necessary in the circumstances. We believe that our audit provides a reasonable basis for our opinion.
Definition and Limitations of Internal Control over Financial Reporting
A company’s internal control over financial reporting is a process designed to provide reasonable assurance regarding the reliability of financial reporting and the preparation of financial statements for external purposes in accordance with generally accepted accounting principles. A company’s internal control over financial reporting includes those policies and procedures that (1) pertain to the maintenance of records that, in reasonable detail, accurately and fairly reflect the transactions and dispositions of the assets of the company; (2) provide reasonable assurance that transactions are recorded as necessary to permit preparation of financial statements in accordance with generally accepted accounting principles, and that receipts and expenditures of the company are being made only in accordance with authorizations of management and directors of the company; and (3) provide reasonable assurance regarding prevention or timely detection of unauthorized acquisition, use, or disposition of the company’s assets that could have a material effect on the financial statements.
Because of its inherent limitations, internal control over financial reporting may not prevent or detect misstatements. Also, projections of any evaluation of effectiveness to future periods are subject to the risk that controls may become inadequate because of changes in conditions, or that the degree of compliance with the policies or procedures may deteriorate.
Material Weaknesses
A material weakness is a deficiency, or a combination of deficiencies, in internal control over financial reporting, such that there is a reasonable possibility that a material misstatement of the company’s annual or interim financial
54
statements will not be prevented or detected on a timely basis. The following material weaknesses have been identified and included in management’s assessment:
Control Environment -The Company identified deficiencies in the principles associated with the control environment component of the COSO framework. Specifically, these control deficiencies constitute material weaknesses, either individually or in the aggregate, relating to the following COSO principles: (i) the organization demonstrates a commitment to integrity and ethical values, (ii) the board of directors demonstrates independence from management and exercises oversight of the development and performance of internal control, (iii) management establishes, with board oversight, structures, reporting lines, and appropriate authorities and responsibilities in pursuit of objectives, (iv) the organization demonstrates a commitment to attract, develop, and retain competent individuals in alignment with objectives, and (v) the organization holds individuals accountable for their internal control related responsibilities in the pursuit of objectives.
The Company did not establish and promote a control environment with an appropriate tone of compliance and control consciousness throughout the entire Company, nor sufficiently promote, monitor, or enforce adherence to its Code of Conduct and Ethics. Additionally, there was a general lack of focus on promoting a culture of compliance within the Company. Results of poor tone at the top included: (i) certain whistleblower allegations were not properly investigated and elevated to the audit committee, (ii) the lack of an employee expense review and approval policy, (iii) two instances of non-compliance with the Company’s Insider Trading Policy, and (iv) instances of non-compliance with the Code of Conduct and Ethics policies.
This material weakness in the control environment contributed to material weaknesses in the following components of the COSO framework.
Information and Communication -The Company identified deficiencies in the principles associated with the information and communication component of the COSO framework. Specifically, these control deficiencies constitute material weaknesses, either individually or in the aggregate, relating to the following COSO principles: (i) the organization internally communicates information, including objectives and responsibilities for internal control, necessary to support the functioning of internal control and (ii) the organization communicates with external parties regarding matters affecting the functioning of internal control.
Factors contributing to the material weakness included miscommunication between management and the Board of Directors regarding the conditionality of certain contracts that resulted in the non-disclosure of such contract commitments and the impact of such commitments on the Company’s future liquidity.
Control Activities -The Company identified deficiencies in the principles associated with the control activities component of the COSO framework. Specifically, these control deficiencies constitute material weaknesses, either individually or in the aggregate, relating to the following COSO principles: (i) the organization selects and develops control activities that contribute to the mitigation of risks to the achievement of objectives to acceptable levels and (ii) the organization deploys control activities through policies that establish what is expected and procedures that put policies into action.
The Company’s failure to maintain an appropriate tone at the top had a pervasive impact, resulting in a risk that could have impacted virtually all financial statement account balances and disclosures.
The COSO component material weaknesses described above contributed to the following material weakness within the Company’s system of internal control over financial reporting at the control activity level.
Related Parties - The Company did not maintain controls designed to sufficiently identify, evaluate, and disclose related party transactions. As a result, two related party transactions were entered into that were not identified by the Company’s controls and given consideration of appropriate disclosure.
These material weaknesses were considered in determining the nature, timing, and extent of audit tests applied in our audit of the consolidated financial statements as of and for the year ended December 31, 2019, of the Company, and this report does not affect our report on such financial statements.
/s/ DELOITTE & TOUCHE LLP
Houston, Texas
June 19, 2020
55
PROPETRO HOLDING CORP.
CONSOLIDATED BALANCE SHEETS
AS OF DECEMBER 31, 2019 AND 2018
(In thousands, except share data)
2019 |
2018 |
||||||
ASSETS |
|||||||
CURRENT ASSETS: |
|||||||
Cash and cash equivalents |
$ |
$ |
|||||
Accounts receivable - net of allowance for doubtful accounts of $1,049 and $100, respectively |
|||||||
Inventories |
|||||||
Prepaid expenses |
|||||||
Other current assets |
|||||||
Total current assets |
|||||||
PROPERTY AND EQUIPMENT - Net of accumulated depreciation |
|||||||
OPERATING LEASE RIGHT-OF-USE ASSETS |
— |
||||||
OTHER NONCURRENT ASSETS: |
|||||||
Goodwill |
|||||||
Intangible assets - net of amortization |
|||||||
Other noncurrent assets |
|||||||
Total other noncurrent assets |
|||||||
TOTAL ASSETS |
$ |
$ |
|||||
LIABILITIES AND SHAREHOLDERS’ EQUITY |
|||||||
CURRENT LIABILITIES: |
|||||||
Accounts payable |
$ |
$ |
|||||
Accrued and other current liabilities |
|||||||
Operating lease liabilities |
|||||||
Finance lease liabilities |
|||||||
Accrued interest payable |
|||||||
Total current liabilities |
|||||||
DEFERRED INCOME TAXES |
|||||||
LONG-TERM DEBT |
|||||||
NONCURRENT OPERATING LEASE LIABILITIES |
|||||||
OTHER LONG-TERM LIABILITIES |
|||||||
Total liabilities |
|||||||
COMMITMENTS AND CONTINGENCIES (Note 18) |
|||||||
SHAREHOLDERS’ EQUITY: |
|||||||
Preferred stock, $0.001 par value, 30,000,000 shares authorized, none issued, respectively |
|||||||
Common stock, $0.001 par value, 200,000,000 shares authorized, 100,624,099 and 100,190,126 shares issued, respectively |
|||||||
Additional paid-in capital |
|||||||
Retained earnings (Accumulated deficit) |
( |
) |
|||||
Total shareholders’ equity |
|||||||
TOTAL LIABILITIES AND SHAREHOLDERS’ EQUITY |
$ |
$ |
|||||
See notes to consolidated financial statements. 56
PROPETRO HOLDING CORP.
CONSOLIDATED STATEMENTS OF OPERATIONS
FOR THE YEARS ENDED DECEMBER 31, 2019, 2018 AND 2017
FOR THE YEARS ENDED DECEMBER 31, 2019, 2018 AND 2017
(In thousands, except per share data)
2019 |
2018 |
2017 |
|||||||||
REVENUE - Service revenue |
$ |
$ |
$ |
||||||||
COSTS AND EXPENSES: |
|||||||||||
Cost of services (exclusive of depreciation and amortization) |
|||||||||||
General and administrative (inclusive of stock‑based compensation) |
|||||||||||
Depreciation and amortization |
|||||||||||
Impairment expense |
|||||||||||
Loss on disposal of assets |
|||||||||||
Total costs and expenses |
|||||||||||
OPERATING INCOME |
|||||||||||
OTHER EXPENSE: |
|||||||||||
Interest expense |
( |
) |
( |
) |
( |
) |
|||||
Other expense |
( |
) |
( |
) |
( |
) |
|||||
Total other expense |
( |
) |
( |
) |
( |
) |
|||||
INCOME BEFORE INCOME TAXES |
|||||||||||
INCOME TAX EXPENSE |
( |
) |
( |
) |
( |
) |
|||||
NET INCOME |
$ |
$ |
$ |
||||||||
NET INCOME PER COMMON SHARE: |
|||||||||||
Basic |
$ |
$ |
$ |
||||||||
Diluted |
$ |
$ |
$ |
||||||||
WEIGHTED AVERAGE COMMON SHARES OUTSTANDING: |
|||||||||||
Basic |
|||||||||||
Diluted |
|||||||||||
See notes to consolidated financial statements. 57
PROPETRO HOLDING CORP.
CONSOLIDATED STATEMENTS OF SHAREHOLDERS’ EQUITY
FOR THE YEARS ENDED DECEMBER 31, 2019, 2018 AND 2017 (In thousands)
FOR THE YEARS ENDED DECEMBER 31, 2019, 2018 AND 2017 (In thousands)
Preferred Stock |
Common Stock |
||||||||||||||||||||||||||||
Shares |
Amount |
Preferred Additional Paid‑In Capital |
Shares |
Amount |
Additional Paid‑In Capital |
Retained Earnings (Accumulated Deficit) |
Total |
||||||||||||||||||||||
BALANCE - January 1, 2017 |
$ |
$ |
$ |
$ |
$ |
( |
) |
$ |
|||||||||||||||||||||
Stock‑based compensation cost |
— |
— |
— |
— |
— |
— |
|||||||||||||||||||||||
Initial Public Offering, net of costs |
— |
— |
— |
— |
|||||||||||||||||||||||||
Conversion of preferred stock to common stock at Initial Public Offering |
( |
) |
( |
) |
( |
) |
— |
— |
|||||||||||||||||||||
Issuance of equity awards—net |
— |
— |
— |
— |
— |
— |
— |
||||||||||||||||||||||
Net income |
— |
— |
— |
— |
— |
— |
|||||||||||||||||||||||
BALANCE - December 31, 2017 |
— |
$ |
— |
$ |
— |
$ |
$ |
$ |
( |
) |
$ |
||||||||||||||||||
Stock‑based compensation cost |
— |
— |
— |
— |
— |
— |
|||||||||||||||||||||||
Issuance of equity awards—net |
— |
— |
— |
— |
|||||||||||||||||||||||||
Issuance of common stock |
— |
— |
— |
— |
|||||||||||||||||||||||||
Net income |
— |
— |
— |
— |
— |
— |
|||||||||||||||||||||||
BALANCE - December 31, 2018 |
— |
$ |
— |
$ |
— |
$ |
$ |
$ |
( |
) |
$ |
||||||||||||||||||
Stock‑based compensation cost |
— |
— |
— |
— |
— |
— |
|||||||||||||||||||||||
Issuance of equity awards—net |
— |
— |
— |
— |
|||||||||||||||||||||||||
Net income |
— |
— |
— |
— |
— |
— |
|||||||||||||||||||||||
BALANCE - December 31, 2019 |
— |
$ |
— |
$ |
— |
$ |
$ |
$ |
$ |
||||||||||||||||||||
See notes to consolidated financial statements. 58
PROPETRO HOLDING CORP.
CONSOLIDATED STATEMENTS OF CASH FLOWS
FOR THE YEARS ENDED DECEMBER 31, 2019, 2018 AND 2017 (In thousands)
CONSOLIDATED STATEMENTS OF CASH FLOWS
FOR THE YEARS ENDED DECEMBER 31, 2019, 2018 AND 2017 (In thousands)
2019 |
2018 |
2017 |
|||||||||
CASH FLOWS FROM OPERATING ACTIVITIES: |
|||||||||||
Net income |
$ |
$ |
$ |
||||||||
Adjustments to reconcile net income to net cash provided by operating activities: |
|||||||||||
Depreciation and amortization |
|||||||||||
Impairment expense |
|||||||||||
Deferred income tax expense |
|||||||||||
Amortization of deferred revenue rebate |
|||||||||||
Amortization of deferred debt issuance costs |
|||||||||||
Stock‑based compensation |
|||||||||||
Provision for bad debt expense |
|||||||||||
Loss on disposal of assets |
|||||||||||
Gain loss on interest rate swap |
( |
) |
|||||||||
Changes in operating assets and liabilities: |
|||||||||||
Accounts receivable |
( |
) |
( |
) |
( |
) |
|||||
Other current assets |
|||||||||||
Inventories |
( |
) |
( |
) |
|||||||
Prepaid expenses |
( |
) |
( |
) |
( |
) |
|||||
Accounts payable |
( |
) |
|||||||||
Accrued liabilities |
|||||||||||
Accrued interest |
( |
) |
|||||||||
Net cash provided by operating activities |
|||||||||||
CASH FLOWS FROM INVESTING ACTIVITIES: |
|||||||||||
Capital expenditures |
( |
) |
( |
) |
( |
) |
|||||
Proceeds from sale of assets |
|||||||||||
Net cash used in investing activities |
( |
) |
( |
) |
( |
) |
|||||
CASH FLOWS FROM FINANCING ACTIVITIES: |
|||||||||||
Proceeds from borrowings |
|||||||||||
Repayments of borrowings |
( |
) |
( |
) |
( |
) |
|||||
Payment of finance lease obligation |
( |
) |
— |
— |
|||||||
Proceeds from insurance financing |
|||||||||||
Repayments of insurance financing |
( |
) |
( |
) |
( |
) |
|||||
Payment of debt issuance costs |
( |
) |
( |
) |
|||||||
Proceeds from exercise of equity awards |
|||||||||||
Proceeds from initial public offering |
|||||||||||
Payment of initial public offering costs |
( |
) |
|||||||||
Net cash provided by (used in) financing activities |
( |
) |
|||||||||
NET INCREASE (DECREASE) IN CASH AND CASH EQUIVALENTS |
( |
) |
|||||||||
CASH AND CASH EQUIVALENTS — Beginning of year |
|||||||||||
CASH AND CASH EQUIVALENTS — End of year |
$ |
$ |
$ |
||||||||
See notes to consolidated financial statements. 59
PROPETRO HOLDING CORP.
NOTES TO CONSOLIDATED FINANCIAL STATEMENTS
1. ORGANIZATION AND HISTORY
ProPetro Holding Corp. (“Holding”), a Texas corporation was formed on April 14, 2007, to serve as a holding company for its wholly owned subsidiary ProPetro Services, Inc. (“Services”), a Texas corporation. Services offers hydraulic fracturing, cementing, coiled tubing, drilling and flowback services to oil and gas producers, located primarily in Texas, Oklahoma, New Mexico and Utah. Holding was converted and incorporated to a Delaware Corporation on March 8, 2017.
Unless otherwise indicated, references in these notes to consolidated financial statements to “ProPetro Holding Corp.,” “the Company,” “we,” “our,” “us” or like terms refer to ProPetro Holding Corp. and Services.
On March 22, 2017, we consummated our initial public offering (“IPO”) in which 25,000,000 shares of our common stock, par value $0.001 per share, were sold at a public offering price of $14.00 per share, with 13,250,000 shares issued and sold by the Company and 11,750,000 shares sold by existing stockholders. We received net proceeds of approximately $170.1 million after deducting $10.9 million of underwriting discounts and commissions, and $4.5 million of other offering expenses. At closing, we used the proceeds (i) to repay $71.8 million in outstanding borrowings under the term loan, (ii) $86.8 million to fund the purchase of additional hydraulic fracturing units and other equipment, and (iii) the remaining for general corporate purposes.
In connection with the IPO, the Company executed a stock split, such that each holder of common stock of the Company received 1.45 shares of common stock for every one share of previous common stock, and all 16,999,990 shares of our outstanding Series A preferred stock converted to common stock on a 1 :1 basis.
Accordingly, any information related to or dependent upon the share or option counts in the 2019, 2018 and 2017 consolidated financial statements and Note 13 Net Income Per Share, Note 14 Stock‑Based Compensation, Note 19 Quarterly Financial Data (Unaudited) have been updated to reflect the effect of the stock split in March 2017, as applicable.
On December 31, 2018, we consummated the purchase of pressure pumping and related assets of Pioneer Natural Resources USA, Inc.(“Pioneer”) and Pioneer Pumping Services, LLC (the “Pioneer Pressure Pumping Acquisition”). The pressure pumping assets acquired were used to provide integrated well completion services in the Permian Basin to Pioneer’s completion and production operations. The acquisition cost of the assets was comprised of $110.0 million of cash and 16.6 million shares of our common stock. The incremental direct cost of $3.4 million incurred to consummate the transaction was capitalized as part of the acquisition cost. The pressure pumping assets acquired included hydraulic fracturing pumps of 510,000 HHP, four coiled tubing units and the associated equipment maintenance facility. In connection with the acquisition, we became a long-term service provider to Pioneer under a pressure pumping services agreement (the “Pioneer Services Agreement”), providing pressure pumping and related services for a term of up to 10 years; provided, that Pioneer has the right to terminate the Pioneer Services Agreement, in whole or in part, effective as of December 31 of each of the calendar years of 2022, 2024 and 2026. Pioneer can increase the number of committed fleets prior to December 31, 2022. Pursuant to the Pioneer Services Agreement, the Company is entitled to receive compensation if Pioneer were to idle committed fleets (“idle fees”); however, we are first required to use all economically reasonable effort to deploy the idled fleets to another customer. At the present, we have eight fleets committed to Pioneer.
Risks and Uncertainties
As an oilfield services company, we are exposed to a number of risks and uncertainties that are inherent to our industry. In addition to such industry-specific risks, the global public health crisis associated with the novel coronavirus (“COVID-19”) pandemic has, and is anticipated to continue to have, an adverse effect on global economic activity for the immediate future and has resulted in travel restrictions, business closures and the institution of quarantining and other restrictions on movement in many communities. The slowdown in global economic activity attributable to the COVID-19 pandemic has resulted in a dramatic decline in the demand for
60
PROPETRO HOLDING CORP.
NOTES TO CONSOLIDATED FINANCIAL STATEMENTS
1. ORGANIZATION AND HISTORY (Continued)
energy, which directly impacts our industry and the Company. In addition, global crude oil prices experienced a collapse starting in early March 2020 as a direct result of failed negotiations between the Organization of the Petroleum Exporting Countries (“OPEC”) and Russia. In response to the global economic slowdown, OPEC had recommended a decrease in production levels in order to accommodate reduced demand. Russia rejected the recommendation of OPEC as a concession to U.S. producers. After the failure to reach an agreement, Saudi Arabia, a dominant member of OPEC, and other Persian Gulf OPEC members announced intentions to increase production and offer price discounts to buyers in certain geographic regions.
As the breadth of the COVID-19 health crisis expanded throughout the month of March 2020 and governmental authorities implemented more restrictive measures to limit person-to-person contact, global economic activity continued to decline commensurately. The associated impact on the energy industry has been adverse and continued to be exacerbated by the unresolved conflict regarding production. In the second week of April 2020, OPEC, Russia and certain other petroleum producing nations (“OPEC+”), reconvened to discuss the matter of production cuts in light of unprecedented disruption and supply and demand imbalances that expanded since the failed negotiations in early March 2020. Tentative agreements were reached to cut production by up to 10 million barrels of oil per day with allocations to be made among the OPEC+ participants. Some of these production cuts went into effect in the first half of May 2020, however, commodity prices remain depressed as a result of an increasingly utilized global storage network and near-term demand loss attributable to the COVID-19 health crisis and related economic slowdown.
The combined effect of COVID-19 and the energy industry disruptions led to a decline in WTI crude oil prices of approximately 67 percent from the beginning of January 2020, when prices were approximately $62 per barrel, through the end of March 2020, when they were just above $20 per barrel. Overall crude oil price volatility has continued despite apparent agreement among OPEC+ regarding production cuts and as of June 17, 2020, the WTI price for a barrel of crude oil was approximately $38.
Despite a significant decline in drilling and completion activities by U.S. producers starting in mid-March 2020, domestic supply is exceeding demand which has led to significant operational stress with respect to capacity limitations associated with storage, pipeline and refining infrastructure, particularly within the Gulf Coast region. The combined effect of the aforementioned factors is anticipated to have an adverse impact on the industry in general and our operations specifically.
Since March 2020, we initiated several actions to mitigate the anticipated adverse economic conditions for the immediate future and to support our financial position and liquidity. The more significant actions that we have taken included: (i) canceling substantially all of our growth capital projects, (ii) significantly reducing our maintenance expenditures and field level consumable costs, (iii) reducing our workforce to follow our activity levels, (iv) efforts to manage our compensation costs, such as compensation reductions and management of work schedules to reduce overtime costs and (v) negotiating more favorable payment terms with certain of our larger vendors and proactively managing our portfolio of accounts receivable.
2. SIGNIFICANT ACCOUNTING POLICIES
A summary of the significant accounting policies consistently applied in the preparation of the accompanying consolidated financial statements are as follows:
61
PROPETRO HOLDING CORP.
NOTES TO CONSOLIDATED FINANCIAL STATEMENTS
2. SIGNIFICANT ACCOUNTING POLICIES (Continued)
financial statements and revenues and expenses during the reporting period. Such estimates include, but are not limited to, allowance for doubtful accounts, useful lives for depreciation of property and equipment, estimates of fair value of property and equipment, estimates related to fair value of reporting units for purposes of assessing goodwill, estimates related to deferred tax assets and liabilities, including any related valuation allowances, and estimates of fair value of stock‑based compensation and finance and operating leases. Actual results could differ from those estimates.
Pressure Pumping — Pressure pumping consists of downhole pumping services, which includes hydraulic fracturing (inclusive of acidizing services) and cementing.
Hydraulic fracturing is a well-stimulation technique intended to optimize hydrocarbon flow paths during the completion phase of wellbores. The process involves the injection of water, sand and chemicals under high pressure into formations. Hydraulic fracturing contracts with our customer have one performance obligation, which is the contracted total stages, satisfied over time. We recognize revenue over time using a progress output method, unit-of-work performed method, which is based on the agreed fixed transaction price and actual stages completed. We believe that recognizing revenue based on actual stages completed faithfully depicts how our hydraulic fracturing services are transferred to our customers over time.
Acidizing, which is part of our hydraulic fracturing operating segment, involves a well-stimulation technique where acid is injected under pressure into formations to form or expand fissures. Acidizing provides downhole solutions, and contracts with customers have one performance obligation, which is satisfied at a point-in-time, upon completion of the contracted service when control is transferred to the customer. Jobs for these services are typically short term in nature, with most jobs completed in less than a day. We recognize acidizing revenue at a point-in-time, upon completion of the performance obligation.
Our cementing services use pressure pumping equipment to deliver a slurry of liquid cement that is pumped down a well between the casing and the borehole. Cementing involves well bonding solutions, and contracts with customers have one performance obligation, which is satisfied at a point-in-time, upon completion of the contracted service when control is transferred to the customer. Jobs for these services are typically short term in nature, with most jobs completed in less than a day. We recognize cementing revenue at a point-in-time, upon completion of the performance obligation.
The transaction price for each performance obligation for all our pressure pumping services are fixed per our contract with customer.
All Other— All other services consist of our drilling, coiled tubing and flowback, which are downhole well stimulation and completion/remedial services. The performance obligation for each of the services has a fixed transaction price which is satisfied at a point-in-time upon completion of the service when control is transferred to the customer. Accordingly, we recognize revenue at a point-in-time, upon completion of the service and transfer of control to the customer.
62
PROPETRO HOLDING CORP.
NOTES TO CONSOLIDATED FINANCIAL STATEMENTS
2. SIGNIFICANT ACCOUNTING POLICIES (Continued)
performance obligation for our then partially completed hydraulic fracturing operations was $43.9 million, which was recorded as part of our pressure pumping segment revenue for the year ended December 31, 2019.
At December 31, 2019, 2018 and 2017 the allowance for doubtful accounts was $1.0 million, $0.1 million and $0.4 million, respectively. During the year ended December 31, 2019, additional allowance for doubtful accounts was $0.9 million and there was no write-off of previously recognized allowance. During the year ended December 31, 2018, additional allowance for doubtful accounts was $0.1 million and the write-off of previously recognized allowance was $0.4 million. During the year ended December 31, 2017, additional allowance for doubtful accounts was $0.1 million and the write-off of previously recognized allowance was $0.2 million.
Land |
Indefinite |
Buildings and property improvements |
5 - 30 years |
Vehicles |
1 ‑ 5 years |
Equipment |
1 ‑ 20 years |
Leasehold improvements |
5 ‑ 20 years |
Upon sale or retirement of property and equipment, including certain major components of our pressure pumping equipment that are replaced, the cost and related accumulated depreciation are removed from the balance sheet and the net amount, less proceeds from disposal, is recognized as a gain or loss in the statement of operations. The Company recorded a loss on disposal of assets of $106.8 million, $59.2 million and $39.1 million for the years ended December 31, 2019, 2018 and 2017, respectively.
63
PROPETRO HOLDING CORP.
NOTES TO CONSOLIDATED FINANCIAL STATEMENTS
2. SIGNIFICANT ACCOUNTING POLICIES (Continued)
reporting unit exceeds the carrying value, no further testing is performed. If the fair value of the reporting unit is less than the carrying value, we consider goodwill to be impaired, and the amount of impairment loss is estimated and recorded in the statement of operations.
In 2011, we acquired Technology Stimulation Services, LLC (“TSS”) for $24.4 million. The assets acquired from TSS were recorded as $15.0 million of equipment with the excess of the purchase price over fair value of the assets recorded as goodwill of $9.4 million. The acquisition complemented our existing pressure pumping business. The transaction has been accounted for using the acquisition method of accounting and, accordingly, assets and liabilities assumed were recorded at their fair values as of the acquisition date. Based on our goodwill impairment tests as of December 31, 2019, 2018 and 2017, we concluded that the goodwill related to TSS acquisition was no t impaired. The goodwill related to the TSS acquisition of $9.4 million is recorded in our pressure pumping reportable segment.
We recognize deferred tax assets to the extent that we believe these assets are more likely than not to be realized. In making such a determination, we consider all positive and negative evidence, including future reversals of existing taxable temporary differences, projected future taxable income, and the results of recent operations. If we determine that we would not be able to fully realize our deferred tax assets in the future, we would record a valuation allowance.
64
PROPETRO HOLDING CORP.
NOTES TO CONSOLIDATED FINANCIAL STATEMENTS
2. SIGNIFICANT ACCOUNTING POLICIES (Continued)
institutions, which at times exceed federally insured limits. The Company monitors the financial condition of the financial institutions in which accounts are maintained and has not experienced any losses in such accounts. The receivables of the Company are spread over a number of customers, a majority of which are credible operators and suppliers to the oil and natural gas industries. The Company performs ongoing evaluations as to the financial condition of its customers with respect to trade receivables.
Recently Issued Accounting Standards Adopted in 2019
In February 2016, the FASB issued Accounting Standard Update (“ASU”) No. 2016-02, Leases. This new lease standard introduces a lessee model that brings most leases on the balance sheet. This new standard increases transparency and comparability by recognizing a lessee’s rights and obligations resulting from leases by recording them on the balance sheet as Right of Use ("ROU") Assets and Lease Liabilities. Leases will be classified as either finance or operating, which will impact the pattern of expense recognition on the income statement. ASU No. 2016-02 also requires additional qualitative and quantitative disclosures to better enable users of financial statements to assess the amount, timing, and uncertainty of cash flows arising from leases. Effective January 1, 2019, we adopted the new leases standard using the modified retrospective transition method and electing to account for comparative periods under legacy GAAP. We also elected other practical expedients provided by the new leases standard, the short-term lease recognition practical expedient in which leases with an initial term of 12 months or less will not be recognized on the balance sheet and the practical expedient to not separate lease and non-lease components for our real estate class of leased assets. See Note 17 for additional disclosures relating to our adoption of ASU 2016-02.
Recently Issued Accounting Standards Not Yet Adopted in 2019
In June 2016, the FASB issued ASU No. 2016-13, Financial Instruments-Credit Losses (Topic 326): Measurement of Credit Losses on Financial Instruments, which introduces a new impairment model for financial instruments that is based on expected credit losses rather than incurred credit losses. The new impairment model applies to most financial assets, including trade accounts receivable and lease receivables. In November 2018, the FASB issued ASU No. 2018-19, Codification Improvements to Topic 326, Financial Instruments-Credit Losses, which clarified that receivables arising from operating leases are not within the scope of ASC 326-20, Financial Instruments-Credit Losses-Measured at Amortized Cost, and should be accounted for in accordance with ASC 842. ASU 2016-13 and ASU 2018-19 are effective for annual periods beginning after December 15, 2019. Effective January 1, 2020, the Company adopted ASU 2016-13 using the modified-retrospective approach. The adoption of this guidance did not materially affect our consolidated financial statements. While there was no material impact to the consolidated financial statements as a result of adoption of ASU 2016-13, as a result of deteriorating economic conditions for the oil and gas industry brought on by the COVID-19 pandemic, during the first quarter of 2020, the Company recorded a provision for credit losses of $4.3 million.
In January 2017, the FASB issued ASU No. 2017-04, Simplifying the Test for Goodwill Impairment, which removes the requirement to compare the implied fair value of goodwill with its carrying amount as part of step two of the goodwill impairment test. As a result, under this ASU, an entity would recognize an impairment charge for the amount by which the carrying amount exceeds the reporting unit's fair value, although the loss recognized should not exceed the total amount of goodwill allocated to that reporting unit. This ASU is effective for impairment tests in fiscal years beginning after December 15, 2019, on a prospective basis. Early adoption is permitted for interim or annual goodwill impairment tests performed on testing dates after January 1, 2017. The adoption of this guidance did not materially affect our consolidated financial statement.
In August 2018, the FASB issued ASU 2018-13, Fair Value Measurement (Topic 820): Disclosure Framework-Changes to the Disclosure Requirements for Fair Value Measurement, which eliminates, adds and modifies certain disclosure requirements for fair value measurements. The Company adopted ASU 2018-13 on January 1, 2020 and determined the adoption of this standard did not impact the Company’s consolidated financial statements.
65
PROPETRO HOLDING CORP.
NOTES TO CONSOLIDATED FINANCIAL STATEMENTS
2. SIGNIFICANT ACCOUNTING POLICIES (Continued)
In December 2019, the FASB issued ASU No 2019-12, Income Taxes (Topic 740): Simplifying the Accounting for Income Taxes. ASU 2019-12 removes certain exceptions to the general principles in Topic 740 in Generally Accepted Accounting Principles. ASU 2019-12 is effective for public entities for fiscal years beginning after December 15, 2020, with early adoption permitted. The Company does not expect ASU 2019-12 to have a material effect on the Company’s consolidated financial statements.
In March 2020, the FASB issued ASU No. 2020-04, Reference Rate Reform, which provides temporary optional guidance to companies impacted by the transition away from the London Interbank Offered Rate (“LIBOR”). The guidance provides certain expedients and exceptions to applying GAAP in order to lessen the potential accounting burden when contracts, hedging relationships, and other transactions that reference LIBOR as a benchmark rate are modified. This guidance is effective upon issuance and expires on December 31, 2022. The Company is currently assessing the impact of the LIBOR transition and this ASU on the Company’s consolidated financial statements.
3. SUPPLEMENTAL CASH FLOWS INFORMATION
|
($ in thousands)
|
|||||||||||
Year Ended December 31, |
|||||||||||
2019 |
2018 |
2017 |
|||||||||
Supplemental cash flows disclosures |
|||||||||||
Interest paid |
$ |
$ |
$ |
||||||||
Income taxes paid |
$ |
$ |
$ |
||||||||
Supplemental disclosure of non‑cash investing and financing activities |
|||||||||||
Capital expenditures included in accounts payable and accrued liabilities |
$ |
$ |
$ |
||||||||
Conversion of preferred stock to common stock at Initial Public Offering |
$ |
$ |
$ |
||||||||
Non-cash purchases of property and equipment |
$ |
$ |
$ |
||||||||
4. FAIR VALUE MEASUREMENTS
Fair value is defined as the price that would be received to sell an asset or paid to transfer a liability (i.e., the “exit price”) in an orderly transaction between market participants at the measurement date.
In determining fair value, the Company uses various valuation approaches and establishes a hierarchy for inputs used in measuring fair value that maximizes the use of relevant observable inputs and minimizes the use of unobservable inputs by requiring that the most observable inputs be used, when available. Observable inputs are inputs that market participants would use in pricing the asset or liability developed based on market data obtained from sources independent of the Company. Unobservable inputs are inputs that reflect the Company’s assumptions about the assumptions other market participants would use in pricing the asset or liability developed based on the best information available in the circumstances. The hierarchy is broken down into three levels based on the observability of inputs as follows:
Level 1 — Valuations based on quoted prices in active markets for identical assets or liabilities that the Company has the ability to access. Valuation adjustments and block discounts are not applied to Level 1 instruments. Since valuations are based on quoted prices that are readily and regularly available in an active market, valuation of these instruments does not entail a significant degree of judgment.
66
PROPETRO HOLDING CORP.
NOTES TO CONSOLIDATED FINANCIAL STATEMENTS
4. FAIR VALUE MEASUREMENTS (Continued)
Level 2 — Valuations based on one or more quoted prices in markets that are not active or for which all significant inputs are observable, either directly or indirectly.
Level 3 — Valuations based on inputs that are unobservable and significant to the overall fair value measurement.
A financial instrument’s categorization within the valuation hierarchy is based upon the lowest level of input that is significant to the fair value measurement. The Company’s assessment of the significance of a particular input to the fair value measurement in its entirety requires judgment and considers factors specific to the asset or liability.
Assets and Liabilities Measured at Fair Value on a Recurring Basis
Our financial instruments include cash and cash equivalents, accounts receivable and accounts payable, accrued liabilities and long-term debt. The estimated fair value of our financial instruments — cash and cash equivalent, accounts receivable and accounts payable and accrued liabilities at December 31, 2019 and 2018 approximated or equaled their carrying value as reflected in our consolidated balance sheets because of their short‑term nature. During the year ended December 31, 2019 and 2018, we did not have a derivative financial instrument. Prior to 2018, we used a derivative financial instrument, an interest rate swap, to manage interest rate risk. Our policies do not permit the use of derivative financial instruments for speculative purposes. We did not designate the interest rate swap as a hedge for accounting purposes. We record all derivatives as of the end of our reporting period in our consolidated balance sheet at fair value, which is based on quoted market prices, which represents a level 1 in the fair value measurement hierarchy.
Assets Measured at Fair Value on a Nonrecurring Basis
Estimated fair value measurements |
|||||||||||||||||||
Balance |
Quoted prices in active market (Level 1) |
Significant other observable inputs (Level 2) |
Significant other unobservable inputs (Level 3) |
Total gains (losses) |
|||||||||||||||
2019: |
|||||||||||||||||||
Property and equipment, net |
$ |
$ |
$ |
$ |
$ |
( |
) |
||||||||||||
2018: |
|||||||||||||||||||
Property and equipment, net |
$ |
$ |
$ |
$ |
$ |
||||||||||||||
In 2019, the depressed cash flows and continued decline in utilization of our drilling and flow back asset groups were indicative of potential impairment, resulting in the Company comparing the carrying value of the asset group with its estimated fair value. We determined that the carrying value of the asset groups was greater than its estimated fair value and accordingly, an impairment was recorded. Impairment loss related to our property and equipment of $1.2 million and $2.2 million was recorded at December 31, 2019 relating to our drilling and flow back asset groups, respectively. No impairment was recorded during the years ended December 31, 2018 and 2017. Prior to the impairment write-down during the year ended December 31, 2019, the drilling assets net carrying value was $3.2 million and our flow back assets net carrying value was $2.2 million. See Note 7, “Impairment of Long‑Lived Assets”.
We generally apply fair value techniques to our reporting units on a nonrecurring basis associated with valuing potential impairment related to goodwill. Our estimate of the reporting unit fair value is based on a combination of income and market approaches, Level 1 and 3, respectively, in the fair value hierarchy. The income approach involves the use of a discounted cash flow method, with the cash flow projections discounted at an appropriate discount rate. The market approach involves the use of comparable public companies’ market multiples in estimating
67
PROPETRO HOLDING CORP.
NOTES TO CONSOLIDATED FINANCIAL STATEMENTS
4. FAIR VALUE MEASUREMENTS (Continued)
the fair value. Significant assumptions include projected revenue growth, capital expenditures, utilization, gross margins, discount rates, terminal growth rates, and weight allocation between income and market approaches. If the reporting unit's carrying amount exceeds its fair value, we consider goodwill impaired, and the impairment is recorded in that period. There were no additions to, or disposal of, goodwill during the years ended December 31, 2019, 2018 and 2017. Based on our annual goodwill impairment test, no impairment of goodwill was recorded for the years ended December 31, 2019, 2018 and 2017.
5. INTANGIBLE ASSETS
Intangible assets are composed of internally developed software. Intangible assets are amortized on a straight‑line basis with a useful life of five years . Amortization expense included in net income for the years ended December 31, 2019, 2018 and 2017 was $0 , $0.3 million and $0.3 million, respectively. The Company’s intangible assets subject to amortization are as follows:
($ in thousands) |
|||||||
December 31, |
|||||||
2019 |
2018 |
||||||
Internally developed software |
$ |
$ |
|||||
Less accumulated amortization |
|||||||
Intangible assets — net |
$ |
$ |
|||||
6. PROPERTY AND EQUIPMENT
($ in thousands) |
|||||||
December 31, |
|||||||
2019 |
2018 |
||||||
Land |
$ |
$ |
|||||
Buildings |
|||||||
Equipment and vehicles |
|||||||
Leasehold improvements |
|||||||
Subtotal |
|||||||
Less accumulated depreciation |
( |
) |
( |
) |
|||
Property and equipment — net |
$ |
$ |
|||||
7. IMPAIRMENT OF LONG‑LIVED ASSETS
Whenever events or circumstances indicate that the carrying value of long‑lived assets may not be recoverable, the Company reviews the carrying value of long‑lived assets, such as property and equipment and other assets to determine if they are recoverable. If any long‑lived assets are determined to be unrecoverable, an impairment is recorded in the period. Asset recoverability is estimated using undiscounted future net cash flows at the lowest identifiable level, excluding interest expense and nonrecurring other income and expense adjustments. During the year, the Company determined the lowest level of identifiable cash flows to be at the asset group level, which consists of hydraulic fracturing, cementing, coiled tubing, flowback and drilling.
The shift to horizontal drilling rigs in the Permian Basin led to the deterioration in utilization of our vertical drilling rigs, and we expected undiscounted future cash flows to be lower than the carrying value of the drilling assets. In addition,
68
PROPETRO HOLDING CORP.
NOTES TO CONSOLIDATED FINANCIAL STATEMENTS
7. IMPAIRMENT OF LONG-LIVED ASSETS (Continued)
the pricing pressure on our flowback services led to a deterioration in the utilization of our flowback assets, resulting in our expected undiscounted future cash flows to be lower than the carrying value. Given that the carrying value of the drilling and flowback assets may not be recoverable, the Company estimated the fair value of each asset group and compared it to its carrying value. Potential impairment exists if the estimated undiscounted future net cash flows for a given asset group is less than the carrying amount of the asset group. The impairment is determined by comparing the estimated fair value with the carrying value of the related asset, and any excess amount by which the carrying value exceeds the fair value is recorded as an impairment in that period. At December 31, 2019, the estimated fair value of the drilling and flowback asset groups was $2.0 million and $0 , respectively. Our fair value estimate for our drilling assets was determined using a market transaction, which represents a level 2 in the fair value measurement hierarchy, while our fair value estimate for our flowback approach was determined using unobservable inputs, which represents a level 3 in the fair value measurement hierarchy. Our fair value estimates required us to use significant other observable inputs including assumptions related to replacement cost, auction value, among others. Accordingly, an impairment expense of $1.2 million and $2.2 million was recorded during the year ended December 31, 2019 for our drilling and flowback asset groups, respectively, because the carrying value of the drilling asset group of $3.2 million and the flowback asset group of $2.2 million was greater than their estimated fair value.
8. DEFERRED REVENUE REBATE
In November 2011, the Company acquired certain oilfield fracturing equipment from a customer and agreed to provide future fracturing services to the customer for a period of 78 months in exchange for a 12 % $25.0 million note payable to the customer. The Company recorded the fracturing equipment at its estimated fair value of approximately $13.0 million and assigned the remaining value of approximately $12.0 million to a deferred revenue rebate account to be amortized over the customer’s 78 ‑month service period. In March 2013, the Company repaid the note payable to the customer. The deferred revenue rebate was fully amortized as of December 31, 2018. Accordingly, for the years ended December 31, 2018 and 2017 the Company recorded $0.6 million and $1.8 million, respectively, of amortization rebate as a reduction of revenue.
9. LONG‑TERM DEBT
ABL Credit Facility
Our revolving credit facility (“ABL Credit Facility”), as amended, has a total borrowing capacity of $300 million (subject to the Borrowing Base limit), with a maturity date of December 19, 2023. The ABL Credit Facility has a borrowing base, as determined monthly, of 85% of monthly eligible accounts receivable less customary reserves (the "Borrowing Base"). The Borrowing Base as of December 31, 2019 was approximately $181.2 million. The ABL Credit Facility includes a Springing Fixed Charge Coverage Ratio to apply when excess availability is less than the greater of (i) 10 % of the lesser of the facility size or the Borrowing Base or (ii) $22.5 million. Under this facility we are required to comply, subject to certain exceptions and materiality qualifiers, with certain customary affirmative and negative covenants, including, but not limited to, covenants pertaining to our ability to incur liens, indebtedness, changes in the nature of our business, mergers and other fundamental changes, disposal of assets, investments and restricted payments, amendments to our organizational documents or accounting policies, prepayments of certain debt, dividends, transactions with affiliates, and certain other activities. Borrowings under the ABL Credit Facility are secured by a first priority lien and security interest in substantially all assets of the Company.
Borrowings under the ABL Credit Facility accrue interest based on a three-tier pricing grid tied to availability, and we may elect for loans to be based on either LIBOR or base rate, plus the applicable margin, which ranges from 1.75 % to 2.25 % for LIBOR loans and 0.75 % to 1.25 % for base rate loans, with a LIBOR floor of zero . The weighted average interest rate for our ABL Credit Facility for the year ended December 31, 2019 was 4.4 %.
In March 2020, we obtained a waiver from our lenders under the ABL Credit Facility to extend the time period for us to provide our lenders the Company’s audited financial statements for the year ended December 31, 2019 to July 31, 2020.
69
PROPETRO HOLDING CORP.
NOTES TO CONSOLIDATED FINANCIAL STATEMENTS
9. LONG‑TERM DEBT (Continued)
($ in thousands) |
|||||||
December 31, |
|||||||
2019 |
2018 |
||||||
ABL Credit Facility |
$ |
$ |
|||||
Total debt |
|||||||
Less current portion of long-term debt |
|||||||
Total long-term debt |
$ |
$ |
|||||
The loan origination costs relating to the ABL Credit Facility are classified as an asset in the balance sheet. The fair value of the ABL Credit Facility approximates its carrying value.
Annual Maturities — Scheduled annual maturities of total debt are as follows at December 31, 2019:
($ in thousands) |
|||
2020 |
$ |
||
2021 |
|||
2022 |
|||
2023 |
|||
2024 and thereafter |
|||
Total |
$ |
||
10. ACCRUED AND OTHER CURRENT LIABILITIES
($ in thousands) |
|||||||
December 31, |
|||||||
2019 |
2018 |
||||||
Accrued capital expenditure |
$ |
$ |
|||||
Accrued insurance |
|||||||
Accrued payroll and related expenses |
|||||||
Accrued taxes and others |
|||||||
Total |
$ |
$ |
|||||
11. EMPLOYEE BENEFIT PLAN
The Company has a 401(k) plan, modified effective January 1, 2019, whereby all employees with sixty days of service may contribute up to $19,000 to the plan annually. The employees vest in the Company contributions to the 401(k) plan 25 % per year, beginning in the employee’s first year of service, with full vesting occurring after four years of service. The employees are fully vested in their contributions when made. The Company matches 100 % of the employee contributions up to 6 % of gross salary, up to the annual limit. During the years ended December 31, 2019, 2018 and 2017, the recorded expense under the plan was $3.0 million, $0.3 million and $0.2 million, respectively.
70
PROPETRO HOLDING CORP.
NOTES TO CONSOLIDATED FINANCIAL STATEMENTS
12. REPORTABLE SEGMENT INFORMATION
The Company has five operating segments for which discrete financial information is readily available: hydraulic fracturing, cementing, coiled tubing, flowback, and drilling. These operating segments represent how the Chief Operating Decision Maker evaluates performance and allocates resources.
On August 31, 2018, we divested our surface air drilling operations, included in our "all other" category, in order to continue to focus and position ourselves as a Permian Basin-focused pressure pumping business because we believe the pressure pumping market in the Permian Basin offers more supportive long-term growth fundamentals. The divestiture of our surface air drilling operations did not qualify for presentation and disclosure as discontinued operations, and accordingly, during the year ended December 31, 2018, we have recorded the resulting loss on disposal of our surface air drilling of $0.3 million as part of our loss on disposal of asset in our consolidated statement of operations. The divestiture of our surface air drilling operations resulted in a reduction in the number of our current operating segments to five . The change in the number of our operating segments did not impact our reportable segment information reported for the years presented.
In accordance with ASC 280—Segment Reporting, the Company has one reportable segment (pressure pumping) comprised of the hydraulic fracturing and cementing operating segments. All other operating segments and corporate administrative expense (inclusive of our stock-based compensation expense, income tax expense and interest expense) are included in the ‘‘all other’’ category in the tables below. Total corporate administrative expense for the years ended December 31, 2019, 2018 and 2017 was $113.0 million, $83.9 million and $35.8 million, respectively.
Our hydraulic fracturing operating segment revenue approximated 95.6 %, 95.4 % and 95.3 % of our pressure pumping revenue for the years ended December 31, 2019, 2018 and 2017, respectively.
Inter-segment revenues are not material and are not shown separately in the table below.
The Company manages and assesses the performance of the reportable segment by its adjusted EBITDA. We define Adjusted EBITDA as earnings before interest expense, income taxes, depreciation and amortization (EBITDA), plus (i) loss/(gain) on disposal of assets, (ii) loss/(gain) on extinguishment of debt, (iii) stock-based compensation, and (iv) other unusual or non‑recurring (income)/expenses, such as impairment charges, severance, costs related to our IPO and costs related to asset acquisitions or one-time professional fees.
71
PROPETRO HOLDING CORP.
NOTES TO CONSOLIDATED FINANCIAL STATEMENTS
12. REPORTABLE SEGMENT INFORMATION (Continued)
Pressure Pumping |
All Other |
Total |
|||||||||
Year ended and as of December 31, 2019 |
|||||||||||
Service revenue |
$ |
$ |
$ |
||||||||
Adjusted EBITDA |
$ |
$ |
( |
) |
$ |
||||||
Depreciation and amortization |
$ |
$ |
$ |
||||||||
Impairment expense |
$ |
$ |
$ |
||||||||
Capital expenditures |
$ |
$ |
$ |
||||||||
Goodwill |
$ |
$ |
$ |
||||||||
Total assets |
$ |
$ |
$ |
||||||||
Pressure Pumping |
All Other |
Total |
|||||||||
Year ended and as of December 31, 2018 |
|||||||||||
Service revenue |
$ |
$ |
$ |
||||||||
Adjusted EBITDA |
$ |
$ |
( |
) |
$ |
||||||
Depreciation and amortization |
$ |
$ |
$ |
||||||||
Capital expenditures |
$ |
$ |
$ |
||||||||
Goodwill |
$ |
$ |
$ |
||||||||
Total assets |
$ |
$ |
$ |
||||||||
Pressure Pumping |
All Other |
Total |
|||||||||
Year ended and as of December 31, 2017 |
|||||||||||
Service revenue |
$ |
$ |
$ |
||||||||
Adjusted EBITDA |
$ |
$ |
( |
) |
$ |
||||||
Depreciation and amortization |
$ |
$ |
$ |
||||||||
Capital expenditures |
$ |
$ |
$ |
||||||||
Goodwill |
$ |
$ |
$ |
||||||||
Total assets |
$ |
$ |
$ |
||||||||
72
PROPETRO HOLDING CORP.
NOTES TO CONSOLIDATED FINANCIAL STATEMENTS
12. REPORTABLE SEGMENT INFORMATION (Continued)
Reconciliation of net income (loss) to adjusted EBITDA ($ in thousands):
Pressure Pumping |
All Other |
Total |
|||||||||
Year ended December 31, 2019 |
|||||||||||
Net income (loss) |
$ |
$ |
( |
) |
$ |
||||||
Depreciation and amortization |
|||||||||||
Interest expense |
|||||||||||
Income tax expense |
|||||||||||
Loss on disposal of assets |
|||||||||||
Impairment expense |
|||||||||||
Stock‑based compensation |
|||||||||||
Other expense |
|||||||||||
Other general and administrative expense (1)
|
|||||||||||
Deferred IPO bonus, retention bonus and severance expense |
|||||||||||
Adjusted EBITDA |
$ |
$ |
( |
) |
$ |
||||||
Pressure Pumping |
All Other |
Total |
|||||||||
Year ended December 31, 2018 |
|||||||||||
Net income (loss) |
$ |
$ |
( |
) |
$ |
||||||
Depreciation and amortization |
|||||||||||
Interest expense |
|||||||||||
Income tax expense |
|||||||||||
Loss (gain) on disposal of assets |
( |
) |
|||||||||
Stock‑based compensation |
|||||||||||
Other expense |
|||||||||||
Other general and administrative expense (1)
|
|||||||||||
Deferred IPO bonus |
|||||||||||
Adjusted EBITDA |
$ |
$ |
( |
) |
$ |
||||||
Pressure Pumping |
All Other |
Total |
|||||||||
Year ended December 31, 2017 |
|||||||||||
Net income (loss) |
$ |
$ |
( |
) |
$ |
||||||
Depreciation and amortization |
|||||||||||
Interest expense |
|||||||||||
Income tax expense |
|||||||||||
Loss on disposal of assets |
|||||||||||
Stock‑based compensation |
|||||||||||
Other expense |
|||||||||||
Other general and administrative expense (1)
|
|||||||||||
Deferred IPO bonus |
|||||||||||
Adjusted EBITDA |
$ |
$ |
( |
) |
$ |
||||||
(1) |
Other general and administrative expense primarily relates to nonrecurring professional fees paid to external consultants in connection with the Company’s expanded audit committee review and advisory services in 2019, and legal settlements in 2018 and 2017. |
73
PROPETRO HOLDING CORP.
NOTES TO CONSOLIDATED FINANCIAL STATEMENTS
12. REPORTABLE SEGMENT INFORMATION (Continued)
Major Customers
The Company had revenue from the following significant customers that accounted for the following percentages of the Company’s total revenue:
Year Ended December 31, |
||||||||
2019 |
2018 |
2017 |
||||||
Customer A |
% |
% |
% |
|||||
Customer B |
% |
% |
% |
|||||
Customer C |
% |
% |
% |
|||||
Customer D |
% |
% |
% |
|||||
Customer E |
% |
% |
% |
|||||
The above significant customers’ revenue that relates to pressure pumping is below:
Year Ended December 31, |
||||||||
2019 |
2018 |
2017 |
||||||
Customer A |
% |
% |
% |
|||||
Customer B |
% |
% |
% |
|||||
Customer C |
% |
% |
% |
|||||
Customer D |
% |
% |
% |
|||||
Customer E |
% |
% |
% |
|||||
13. NET INCOME PER SHARE
Basic net income per common share is computed by dividing the net income relevant to the common stockholders by the weighted-average number of shares outstanding during the year. Diluted net income per common share uses the same net income divided by the sum of the weighted-average number of shares of common stock outstanding during the period, plus dilutive effects of options, performance stock units and restricted stock units outstanding during the period calculated using the treasury method and the potential dilutive effects of preferred stocks (if any) calculated using the if-converted method.
(In thousands, except for per share data) |
|||||||||||
|
Year Ended December 31,
|
|||||||||||
2019 |
2018 |
2017 |
|||||||||
Numerator (both basic and diluted) |
|||||||||||
Net income relevant to common stockholders |
$ |
$ |
$ |
||||||||
Denominator |
|||||||||||
Denominator for basic net income per share |
|||||||||||
Dilutive effect of stock options |
|||||||||||
Dilutive effect of performance stock units |
|||||||||||
Dilutive effect of restricted stock units |
|||||||||||
Denominator for diluted net income per share |
|||||||||||
Basic net income per common share |
$ |
$ |
$ |
||||||||
Diluted net income per common share |
$ |
$ |
$ |
||||||||
74
PROPETRO HOLDING CORP.
NOTES TO CONSOLIDATED FINANCIAL STATEMENTS
14. STOCK‑BASED COMPENSATION
2017 Incentive Award Plan
In March 2017, our shareholders approved the ProPetro Holding Corp. 2017 Incentive Award Plan (the "Incentive Plan") pursuant to which our Board of Directors may grant stock options, restricted stock units ("RSUs"), performance stock units ("PSUs"), or other stock-based awards to consultants, directors, executives and employees. The Incentive Plan authorizes up to 5,800,000 shares of common stock to be issued under awards granted pursuant to the plan.
Stock Options
On June 14, 2013, we granted 2,799,408 stock option awards to certain key employees, officers and directors pursuant to the Stock Option Plan that vested and became exercisable based upon the achievement of a service requirement. The options vested in 25 % increments for each year of continuous service and an option became fully vested upon the optionee’s completion of the fourth year of service. The contractual term for the options awarded is 10 years. The fair value of each option award granted was estimated on the date of grant using the Black-Scholes option-pricing model.
On July 19, 2016, we granted 1,274,549 stock option awards to certain key employees, officers and directors pursuant to the Stock Option Plan which vested in five substantially equal semi-annual installments commencing in December 2016, subject to a continuing services requirement. The contractual term for the options awarded is 10 years. We fully accelerated vesting of the options in connection with our IPO. The fair value of each option award granted was estimated on the date of grant using the Black-Scholes option-pricing model.
On March 16, 2017, we granted 793,738 stock option awards to certain key employees, officers and directors pursuant to the Incentive Plan which are scheduled to vest in four substantially equal annual installments, subject to a continuing service requirement. The contractual term for the options awarded is 10 years. The fair value of each stock option award granted was estimated on the date of grant using the Black-Scholes option-pricing model. There were no new stock option grants during the years ended December 31, 2019 and 2018. The weighted average grant-date fair value of stock options granted during the year ended December 31, 2017 was $3.35 .
As of December 31, 2019, the aggregate intrinsic value for our outstanding stock options was $28.6 million, and the aggregate intrinsic value for our exercisable stock options was $28.6 million. The aggregate intrinsic value for the exercised stock options during the year ended December 31, 2019 was $2.9 million. The remaining contractual term for the outstanding and exercisable stock options as of December 31, 2019, was 4.9 years and 4.7 years, respectively. For the years ended December 31, 2019, 2018 and 2017, the Company recognized approximately $0.5 million, $0.6 million and $2.9 million, respectively, in compensation expense related to stock options.
Number of Shares |
Weighted Average Exercise Price |
|||||
Outstanding at January 1, 2019 |
$ |
|||||
Granted |
$ |
|||||
Exercised |
( |
) |
$ |
|||
Forfeited |
( |
) |
$ |
|||
Expired |
( |
) |
$ |
|||
Outstanding at December 31, 2019 |
$ |
|||||
Exercisable at December 31, 2019 |
$ |
|||||
75
PROPETRO HOLDING CORP.
NOTES TO CONSOLIDATED FINANCIAL STATEMENTS
14. STOCK‑BASED COMPENSATION (Continued)
Restricted Stock Units
In 2019, we granted 424,624 RSUs to key employees, officers and directors pursuant to the Incentive Plan, which generally vest ratably over a three-year vesting period, in the case of awards to employees and officers, and generally vest in full after one year, in the case of awards to directors. RSUs are subject to restrictions on transfer and are generally subject to a risk of forfeiture if the award recipient ceases to be an employee or director of the Company prior to vesting of the award. Each RSU represents the right to receive one share of common stock. The grant date fair value of the RSUs was based on the closing share price of our common stock on the date of grant. For the years ended December 31, 2019, 2018 and 2017, the Company recognized stock compensation expense for RSUs of approximately $3.5 million, $2.9 million and $6.2 million, respectively. As of December 31, 2019, the total unrecognized compensation expense for all RSUs was approximately $6.4 million, and is expected to be recognized over a weighted-average period of approximately 1.8 years.
Number of Shares |
Weighted Average Grant Date Fair Value |
||||||
Outstanding at January 1, 2019 |
$ |
||||||
Granted |
$ |
||||||
Vested |
( |
) |
$ |
||||
Forfeited |
( |
) |
$ |
||||
Canceled |
$ |
||||||
Outstanding at December 31, 2019 |
$ |
||||||
Performance Stock Units
In 2019, we granted PSUs to certain key employees and officers under the Incentive Plan. The actual number of shares of common stock that may be issued under the PSUs ranges from zero up to a maximum of 200% of the target number of PSUs granted to the participant, based on our total shareholder return (“TSR”) relative to a designated peer group from January 1, 2019 through December 31, 2021. In addition to the TSR conditions, vesting of the PSUs is generally subject to the recipient’s continued employment through the end of the applicable performance period. Compensation expense is recorded ratably over the corresponding requisite service period. The grant date fair value of PSUs was determined using a Monte Carlo probability model. Grant recipients do not have any shareholder rights until performance relative to the peer group has been determined following the completion of the performance period and shares have been issued. For the years ended December 31, 2019, 2018 and 2017 the Company recognized stock compensation expense for the PSUs of approximately $3.8 million, $2.0 million and $0.4 million, respectively.
Period Granted |
Target Shares Outstanding at January 1, 2019 |
Target Shares Granted |
Target Shares Vested |
Target Shares Forfeited |
Target Shares Outstanding at December 31, 2019 |
Weighted Average Grant Date Fair Value per Share |
|||||||||||||
2017 |
( |
) |
$ |
||||||||||||||||
2018 |
( |
) |
( |
) |
$ |
||||||||||||||
2019 |
( |
) |
( |
) |
$ |
||||||||||||||
Total |
( |
) |
( |
) |
$ |
||||||||||||||
76
PROPETRO HOLDING CORP.
NOTES TO CONSOLIDATED FINANCIAL STATEMENTS
14. STOCK‑BASED COMPENSATION (Continued)
15. INCOME TAXES
The components of the provision for income taxes are as follows:
($ in thousands) |
|||||||||||
Year Ended December 31, |
|||||||||||
2019 |
2018 |
2017 |
|||||||||
Federal: |
|||||||||||
Current |
$ |
$ |
$ |
( |
) |
||||||
Deferred |
|||||||||||
State: |
|||||||||||
Current |
|||||||||||
Deferred |
( |
) |
|||||||||
( |
) |
||||||||||
Total income tax expense |
$ |
$ |
$ |
||||||||
Reconciliation between the amounts determined by applying the federal statutory rate of 21 % for years ended December 31, 2019 and 2018 and 35 % for the year ended December 31, 2017 to income tax expense is as follows:
($ in thousands) |
|||||||||||
Year Ended December 31, |
|||||||||||
2019 |
2018 |
2017 |
|||||||||
Taxes at federal statutory rate |
$ |
$ |
$ |
||||||||
State taxes, net of federal benefit |
|||||||||||
Non-deductible expenses |
|||||||||||
Stock-based compensation |
( |
) |
( |
) |
( |
) |
|||||
Valuation allowance |
( |
) |
|||||||||
Effect of change in enacted tax rate |
( |
) |
|||||||||
Other |
( |
) |
|||||||||
Total income tax expense |
$ |
$ |
$ |
||||||||
77
PROPETRO HOLDING CORP.
NOTES TO CONSOLIDATED FINANCIAL STATEMENTS
15. INCOME TAXES (Continued)
Deferred tax assets and liabilities are recognized for estimated future tax effects of temporary differences between the tax basis of an asset or liability and its reported amount in the consolidated financial statements. The significant items giving rise to deferred tax assets (liabilities) are as follows:
($ in thousands) |
|||||||
|
December 31,
|
|||||||
2019 |
2018 |
||||||
Deferred Income Tax Assets |
|||||||
Accrued liabilities |
$ |
$ |
|||||
Allowance for doubtful accounts |
|||||||
Lease liabilities |
— |
||||||
Goodwill and other intangible assets |
|||||||
Stock‑based compensation |
|||||||
Net operating losses |
|||||||
Other |
|||||||
Total deferred tax assets |
|||||||
Valuation allowance |
|||||||
Total deferred tax assets — net |
$ |
$ |
|||||
Deferred Income Tax Liabilities |
|||||||
Property and equipment |
$ |
( |
) |
$ |
( |
) |
|
Prepaid expenses |
( |
) |
( |
) |
|||
Total deferred tax liabilities |
$ |
( |
) |
$ |
( |
) |
|
Net deferred tax liabilities |
$ |
( |
) |
$ |
( |
) |
|
At December 31, 2019, the Company had approximately $304.7 million of federal net operating loss carryforwards some of which will begin to expire in 2035. After January 1, 2018, federal net operating loss carryforwards can be carried forward indefinitely. Approximately $229.5 million of our federal net operating loss carryfoward relates to pre-2018 periods which are not subject to an annual 80% limitation of taxable income. Our state net operating losses is approximately $50.4 million and will begin to expire in 2024. Utilization of net operating loss carryforwards may be limited due to past or future ownership changes. As of December 31, 2019, we determined that no valuation allowance was necessary against our deferred tax assets.
The Company’s U.S. federal income tax returns for the year ended December 31, 2016 and through the most recent filing remain open to examination by the Internal Revenue Service under the applicable U.S. federal statute of limitations provisions. The various states in which the Company is subject to income tax are generally open to examination for the tax years ended December 31, 2015 and through the most recent filing.
On December 22, 2017, the U.S. government enacted comprehensive tax legislation commonly referred to as the Tax Cuts and Jobs Act (“Tax Act”). The Tax Act makes broad and complex changes to the U.S. tax code including, but not limited to (1) reducing the U.S. federal corporate tax rate from 35% to 21%, (2) eliminating the corporate alternative minimum tax (“AMT’’) and changing how existing AMT credits can be realized, (3) creating a new limitation on deductible interest expense, (4) changes to bonus depreciation, and (5) changing rules related to use and limitations of net operating loss carryforwards for tax years beginning after December 31, 2017. We have completed our analysis of the Tax Act. The only material items that impacted the Company’s consolidated financial statements in 2017 was the corporate rate reduction. While the corporate rate reduction was effective January 1, 2018, we accounted for the effect of the rate change during the year ended December 31, 2017, the year of enactment. Consequently, we recorded a $3.4 million decrease to the net deferred tax liability.
78
PROPETRO HOLDING CORP.
NOTES TO CONSOLIDATED FINANCIAL STATEMENTS
15. INCOME TAXES (Continued)
We record uncertain tax positions in accordance with ASC 740, Income Taxes, on the basis of a two-step process in which (1) we determine whether it is more likely than not that the tax positions will be sustained on the basis of the technical merits of the position and (2) for those tax positions that meet the more-likely-than-not recognition threshold, we recognize the largest amount of tax benefit that is more than fifty percent likely to be realized upon ultimate settlement with the related tax authority. As of December 31, 2019, 2018 and 2017, no uncertain tax positions were recorded. The Company will continue to evaluate its tax positions in accordance with ASC 740 and will recognize any future effect as a charge to income in the applicable period.
Income tax penalties and interest assessments recognized under ASC 740 are accrued as a tax expense in the period that the Company’s taxes are in an uncertain tax position. Any accrued tax penalties or interest assessments will remain until the uncertain tax position is resolved with the taxing authorities or until the applicable statute of limitations has expired.
16. RELATED‑PARTY TRANSACTIONS
Corporate Office Building
The Company rents its corporate office building and the associated real property from an entity, in which a former executive officer of the Company has an equity interest. The rent expense on our corporate office building is approximately $0.1 million per year. During the years ended December 31, 2019 and 2018, the Company incurred costs of approximately $1.6 million and $0.9 million, respectively, for improvements made to our corporate office building that we rent. In April 2020, the Company acquired the corporate office building and associated real property for approximately$1.5 million.
Operations and Maintenance Yards
The Company also rents five yards from an entity, which certain former executive officers, an executive officer and a director of the Company have equity interests and total annual rent expense for each of the five yards was approximately $0.03 million, $0.03 million, $0.1 million, $0.1 million, and $0.2 million, respectively. The Company also leased a yard from another entity, which a certain executive officer of the Company has an equity interest, and with annual lease expense of $0.1 million.
Subsequent to the issuance of the consolidated financial statements for the year ended December 31, 2018 we identified the following related party transaction. In 2018, the Company entered into a construction and purchase agreement for a maintenance facility for our pressure pumping operations with a developer. The developer for the maintenance facility was an equal partner with a former executive officer of the Company in a separate legal entity. The entity the former executive officer was associated with provided funding to the developer related to the construction of the maintenance facility. The construction and purchase cost of $2.3 million was paid to the developer during the year ended December 31, 2018.
Transportation and Equipment Rental
For the years ended December 31, 2019, 2018 and 2017, the Company incurred costs for transportation services with an entity, in which a former executive officer of the Company had an equity interest, of approximately $0.2 million, $0.4 million and $0.3 million, respectively. During the years ended December 31, 2018 and 2017, the partner in the entity with the former executive officer reimbursed the Company approximately $0.05 million and $0.1 million, respectively, for the use of the Company’s personnel to operate the transportation equipment.
The Company also rented equipment in Elk City, Oklahoma for our flowback operations from an entity, which a former executive officer of the Company has an equity interest. For the years ended December 31, 2019, 2018 and 2017, the Company incurred and paid $0.2 million, $0.2 million and $0.2 million, respectively. This rental arrangement was terminated in January 2020.
79
PROPETRO HOLDING CORP.
NOTES TO CONSOLIDATED FINANCIAL STATEMENTS
16. RELATED-PARTY TRANSACTIONS (Continued)
At December 31, 2019 and 2018, the Company had $0 and $0.01 million in payables to the above related parties, respectively. There were no receivables at December 31, 2019 and 2018 from the above related party transactions.
PT Petroleum, LLC
Subsequent to the issuance of the consolidated financial statements for the year ended December 31, 2018 we identified the following related party transaction. For the years ended December 31, 2018 and 2017, the Company provided services to PT Petroleum, LLC, an entity in which a director was an officer, of approximately $16.7 million and $39.0 million, respectively.
Pioneer
On December 31, 2018, we consummated the purchase of certain pressure pumping assets and real property in connection with the Pioneer Pressure Pumping Acquisition. The acquisition cost of the assets was comprised of approximately $110.0 million of cash and 16.6 million shares of our common stock. In connection with the consummation of the Pioneer Pressure Pumping Acquisition and effective January 1, 2019, we became a long-term service provider to Pioneer, providing pressure pumping and related services for a term of up to ten years . Revenue from services provided to Pioneer accounted for approximately $524.2 million, $76.0 million and $36.0 million of our total revenue during the years ended December 31, 2019, 2018 and 2017, respectively. During 2019, the Company reimbursed Pioneer approximately $4.2 million for our portion of the retention bonuses paid to former Pioneer employees that were subsequently employed by the Company and also Pioneer reimbursed the Company approximately $2.5 million for severance payments made on their behalf, in connection with the Pioneer Pressure Pumping Acquisition. As of December 31, 2019, the total accounts receivable due from Pioneer, including estimated unbilled receivable for services we provided, amounted to $61.7 million and the amount due to Pioneer was $0 .
17. LEASES
Operating Leases
Description of Lease
In March 2013, we entered into a ten-year real estate lease contract (the "Real Estate Lease") with a commencement date of April 1, 2013, as part of the expansion of our equipment yard. The lease is with an entity in which a director of the Company has a noncontrolling equity ownership interest. For the years ended December 31, 2019, 2018 and 2017, the Company made lease payments of approximately $0.4 million, $0.3 million and $0.3 million, respectively. The assets and liabilities under this contract are equally allocated between our cementing and coiled tubing segments. In addition to the contractual lease period, the contract includes an optional renewal of up to ten years, and in management's judgment the exercise of the renewal option is not reasonably assured. The contract does not include a residual value guarantee, covenants or financial restrictions. Further, the Real Estate Lease does not contain variability in payments resulting from either an index change or rate change. Effective January 1, 2019, the remaining lease term in our present value estimate of the minimum future lease payments was four years.
Consistent with the requirements of the new lease standard, ASC 842, we have determined the Real Estate Lease to be an operating lease. Our assumptions resulted from the existence of the right to control the use of the assets throughout the lease term. We did not account for the land separately from the building of the real estate lease
80
PROPETRO HOLDING CORP.
NOTES TO CONSOLIDATED FINANCIAL STATEMENTS
17. LEASES (Continued)
because we concluded that the accounting effect was insignificant. As of December 31, 2019, the weighted average discount rate and remaining lease term was 6.7 % and 3.3 years, respectively.
In January 2019, we entered into a four-year real estate lease contract with Pioneer, a related party, (the "Crew Camp Lease") with a commencement date of January 1, 2019 for purposes of providing housing to Company personnel. The contract does not include a residual value guarantee, covenants or financial restrictions. Further, the Crew Camp Lease does not contain variability in payments resulting from either an index change or rate change. The lease term used in our estimate of the present value of the minimum future lease payments for the purpose of determining our right-of-use asset and lease obligation was four-years. We determined the Crew Camp Lease to be an operating lease. However, effective July 1, 2019, the Crew Camp Lease was terminated in connection with our disposal of our camp assets located at the leased real estate for $5.0 million. In connection with the Crew Camp Lease termination, we derecognized the right-of-use asset and lease liability of $0.5 million and $0.5 million, respectively. The total operating lease cost recorded during the year ended December 31, 2019, in connection with the Crew Camp Lease was $0.1 million. Effective July 1, 2019, we disposed of our camp assets and entered into a twelve month lease (the "Lodging Lease"), which we determined to be a short-term lease, to rent a certain number of rooms daily, including related services, for a fixed rate and accordingly, we recorded a gain on sale in our statement of operations during the year ended December 31, 2019 of approximately $4.2 million.
As of December 31, 2019, our total operating lease right-of-use asset cost was $1.2 million, and accumulated amortization was $0.3 million. For the year ended December 31, 2019, we recorded operating lease cost of $0.4 million in our statement of operations. During the years ended December 31, 2018 and 2017, our operating lease expense, under legacy GAAP, ASC 840, was $1.7 million and $1.4 million, respectively.
Finance Leases
Description of Ground Lease
In 2018, we entered into a ten-year land lease contract (the "Ground Lease") with an exclusive option to purchase the land exercisable beginning one year from the commencement date of October 1, 2018 through the end of the contractual lease term. The Ground Lease does not include any residual value guarantee, covenants or financial restrictions. Further, the Ground Lease does not contain variability in payments resulting from either an index change or rate change. The remaining lease term used in our estimate of the present value of the minimum future lease payments for the purpose of determining our right-of-use asset and lease obligation was 1.2 years, assuming we will exercise our option to purchase the land shortly after the option becomes exercisable.
Consistent with the requirements of the new lease standard, ASC 842, we have determined the Ground Lease to be a finance lease. Our assumptions resulted from the existence of the right to control the use of the land for a period of time and the option to purchase the land, which we are reasonably certain of exercising shortly after 1.0 year from the commencement date. As of December 31, 2019, the weighted average discount rate and remaining lease term was 4.3 % and 0.2 years, respectively.
As of December 31, 2019, our net finance lease right-of-use asset included as part of property and equipment in our consolidated balance sheet consists of a cost of $3.1 million and accumulated amortization of $0 . The interest on our finance lease for the year ended December 31, 2019 was $0.1 million. No amortization was recorded in the period for our finance lease right-of-use asset because it is comprised of land. In March 2020, the Company exercised its option and purchased the land associated with the Ground Lease.
81
PROPETRO HOLDING CORP.
NOTES TO CONSOLIDATED FINANCIAL STATEMENTS
17. LEASES (Continued)
Leases |
||||||||
($ in thousands) |
Operating |
Finance |
||||||
2020 |
$ |
$ |
||||||
2021 |
||||||||
2022 |
||||||||
2023 |
||||||||
2024 |
||||||||
Total undiscounted future lease payments |
||||||||
Amount representing interest |
( |
) |
( |
) |
||||
Present value of future lease payments (lease obligation) |
$ |
$ |
||||||
The total cash paid in connection with our operating and finance lease liabilities during the year ended December 31, 2019 was $0.4 million and $0.4 million, respectively. The non-cash lease obligation we recorded effective January 1, 2019, upon adopting the new lease standard, ASC 842, was $2.0 million and $3.1 million for operating and finance leases, respectively. The non-cash changes to our lease liabilities during the year ended December 31, 2019, relate to the derecognition of the lease liability of $0.5 million, in connection with the Crew Camp Lease termination on July 1, 2019.
Short-Term Leases
We elected the practical expedient, consistent with ASC 842, to exclude leases with an initial term of twelve months or less ("short-term leases") from our balance sheet and continue to record short-term leases as a period expense. For the year ended December 31, 2019, our short-term asset lease and Lodging Lease expense was approximately $1.3 million and $2.4 million, respectively. At December 31, 2019, the total remaining commitments and other obligations for all of our short-term lease and lodging arrangements was $6.9 million.
82
PROPETRO HOLDING CORP.
NOTES TO CONSOLIDATED FINANCIAL STATEMENTS
18. COMMITMENTS AND CONTINGENCIES
Commitments
|
($ in thousands)
|
||||
2019 |
$ |
|||
2020 |
||||
2021 |
||||
2022 |
||||
2023 and thereafter |
||||
Total |
$ |
|||
As of December 31, 2019, the Company has an agreement with its equipment manufacturer granting the Company the option to purchase additional 108,000 of DuraStim® hydraulic horsepower (“HHP”), with the purchase option expiring at different times through April 30, 2021. The option fee of $6.1 million, which we have classified as a deposit for property and equipment, will be applied equally towards the purchase price of each additional DuraStim® fleet ordered. As of December 31, 2019, the total outstanding remaining contractual obligations under the purchase agreement for the original DuraStim® fleets and related ancillary equipment was $1.7 million.
As of December 31, 2019, other contracted capital commitments entered into as part of normal course of business for supply of certain equipment, including improvement to our corporate office building, was $2.7 million.
The Company enters into purchase agreements with its sand suppliers (the “Sand suppliers”) to secure supply of sand as part of its normal course of business. The agreements with the Sand suppliers require that the Company purchase a minimum volume of sand, constituting substantially all of its sand requirements, from the Sand suppliers, otherwise certain penalties may be charged. Under certain of the purchase agreements, a shortfall fee applies if the Company purchases less than the minimum volume of sand. The shortfall fee represents liquidated damages and is either a fixed percentage of the purchase price for the minimum volumes or a fixed price per ton of unpurchased volumes. Under one of the purchase agreements, the Company is obligated to purchase a specified percentage of its overall sand requirements, or it must pay the supplier the difference between the purchase price of the minimum volumes under the purchase agreement and the purchase price of the volumes actually purchased. Our minimum volume commitments under the purchase agreements are either based on a percentage of our total usage or fixed minimum quantity. Our agreements with the Sand suppliers expire at different times prior to April 30, 2022. During the years ended December 31, 2019, 2018 and 2017, no shortfall fees have been recorded. One of the Sand suppliers (“SandCo”) we entered into an agreement with to purchase sand (“Texas sand”) has an indirect relationship with a former executive officer of the Company, because beginning in 2018, the Texas sand was sourced from a mine located on land owned by an entity (“LandCo”) in which the former executive officer has a 44 % noncontrolling equity interest in the LandCo. The total sand purchased from SandCo during the year ended December 31, 2019 and 2018 was approximately $44.3 million and $10.3 million, respectively, and the estimated indirect benefit to the former executive officer of the Company was approximately $1.5 million and $0.4 million, respectively.
As of December 31, 2019 and 2018, the Company had issued letters of credit of $1.5 million and $1.8 million, respectively, under the Company's ABL Credit Facility relating to the Company's casualty insurance policy.
During the year ended December 31, 2019, we recorded severance expense of approximately $2.0 million relating to the resignation of two former executive officers, which was included as part of our general and
83
PROPETRO HOLDING CORP.
NOTES TO CONSOLIDATED FINANCIAL STATEMENTS
18. COMMITMENTS AND CONTINGENCIES (Continued)
administrative expense in our statement of operations and the outstanding balance included in accrued liabilities and other current liabilities in our consolidated balance sheet at December 31, 2019.
Contingent Liabilities
In September 2019, a complaint, captioned Richard Logan, Individually and On Behalf of All Others Similarly Situated, Plaintiff, v. ProPetro Holding Corp., et al., (the “Logan Lawsuit”), was filed against the Company and certain of its current and former officers and directors in the U.S. District Court for the Western District of Texas.
In April 2020, Lead Plaintiffs Nykredit Portefølje Administration A/S, Oklahoma Firefighters Pension and Retirement System, Oklahoma Law Enforcement Retirement System, Oklahoma Police Pension and Retirement System, and Oklahoma City Employee Retirement System, and additional named plaintiff Police and Fire Retirement System of the City of Detroit, individually and on behalf of a putative class of shareholders who purchased the Company’s common stock between March 17, 2017 and March 13, 2020, filed a second amended class action complaint in the U.S. District Court for the Western District of Texas in the Logan Lawsuit, alleging violations of Sections 10(b) and 20(a) of the Exchange Act, as amended, and Rule l0b-5 promulgated thereunder, and Sections 11 and 15 of the Securities Act, as amended, based on allegedly inaccurate or misleading statements, or omissions of material facts, about the Company’s business, operations and prospects.
In January 2020, Boca Raton Firefighters’ and Police Pension Fund (“Boca Raton”) filed a shareholder derivative suit in the U.S. District Court for the Western District of Texas (the “Boca Raton Lawsuit”) against certain of the Company’s current and former officers and directors (the “Boca Raton Defendants”). The Company was named as a nominal defendant only. The claims include (i) breaches of fiduciary duties, (ii) unjust enrichment and (iii) contribution. Boca Raton did not quantify any alleged damages in its complaint but, in addition to attorneys’ fees and costs, Boca Raton seeks various forms of relief, including (i) damages sustained by the Company as a result of the Boca Raton Defendants’ alleged misconduct, (ii) punitive damages and (iii) equitable relief in the form of improvements to the Company’s governance and controls.
In April 2020, Jye-Chun Chang filed a shareholder derivative suit in the U.S. District Court for the Western District of Texas (the “Chang Lawsuit”) against certain of the Company’s current and former officers and directors (the “Chang Defendants”). The Company was named as a nominal defendant only. The claims include (i) violations of section 14(a) of the Exchange Act, (ii) breach of fiduciary duties, (iii) unjust enrichment, (iv) abuse of control, (v) gross mismanagement and (vi) waste of corporate assets. Chang did not quantify any alleged damages in its complaint but, in addition to attorneys’ fees and costs, Chang seeks various forms of relief, including (i) declaring that Chang may sustain the action on behalf of the Company, (ii) declaring that the Chang Defendants breached their fiduciary duties to the Company, (iii) damages sustained by the Company as a result of the Chang Defendants’ alleged misconduct, (iv) equitable relief in the form of improvements to the Company’s governance and controls and (v) restitution.
In October 2019, the Company received a letter from the SEC indicating that the SEC had opened an investigation into the Company and requesting that the Company provide certain information and documents, including documents related to the Company’s expanded audit committee review and related events. The Company has cooperated and expects to continue to cooperate with the SEC’s investigation.
We are presently unable to predict the duration, scope or result of the Logan Lawsuit, the Boca Raton Lawsuit, the Chang Lawsuit, the SEC investigation, or any other related lawsuit or investigation. As of December 31, 2019, no provision was made by the Company in connection with these pending lawsuits and the SEC investigation as they are still at early stages and the final outcomes cannot be reasonably estimated.
84
PROPETRO HOLDING CORP.
NOTES TO CONSOLIDATED FINANCIAL STATEMENTS
18. COMMITMENTS AND CONTINGENCIES (Continued)
Environmental
The Company is subject to various federal, state and local environmental laws and regulations that establish standards and requirements for protection of the environment. The Company cannot predict the future impact of such standards and requirements, which are subject to change and can have retroactive effectiveness. The Company continues to monitor the status of these laws and regulations. Currently, the Company has not been fined, cited or notified of any environmental violations that would have a material adverse effect upon its financial position, liquidity or capital resources. However, management does recognize that by the very nature of the Company's business, material costs could be incurred in the near term to maintain compliance. The amount of such future expenditures is not determinable due to several factors, including the unknown magnitude of possible regulation or liabilities, the unknown timing and extent of the corrective actions which may be required, the determination of the Company's liability in proportion to other responsible parties and the extent to which such expenditures are recoverable from insurance or indemnification.
Regulatory Audits
In 2019, the Texas Comptroller of Public Accounts commenced a routine audit of the Company's gross receipts and sales, excise and use taxes for the periods of July 2015 through December 2018. As of December 31, 2019, the audit is still at an early stage and the final outcome cannot be reasonably estimated.
85
PROPETRO HOLDING CORP.
NOTES TO CONSOLIDATED FINANCIAL STATEMENTS
19. QUARTERLY FINANCIAL DATA (UNAUDITED)
(In thousands, except for per share data) |
|||||||||||||||
2019 |
|||||||||||||||
First Quarter |
Second Quarter |
Third Quarter |
Fourth Quarter |
||||||||||||
Revenue - Service revenue |
$ |
$ |
$ |
$ |
|||||||||||
Gross profit |
$ |
$ |
$ |
$ |
|||||||||||
Net income |
$ |
$ |
$ |
$ |
|||||||||||
Net income per common share: |
|||||||||||||||
Basic |
$ |
$ |
$ |
$ |
|||||||||||
Diluted |
$ |
$ |
$ |
$ |
|||||||||||
Weighted average common shares outstanding: |
|||||||||||||||
Basic |
|||||||||||||||
Diluted |
|||||||||||||||
2018 |
|||||||||||||||
First Quarter |
Second Quarter |
Third Quarter |
Fourth Quarter |
||||||||||||
Revenue - Service revenue |
$ |
$ |
$ |
$ |
|||||||||||
Gross profit |
$ |
$ |
$ |
$ |
|||||||||||
Net income |
$ |
$ |
$ |
$ |
|||||||||||
Net income per common share: |
|||||||||||||||
Basic |
$ |
$ |
$ |
$ |
|||||||||||
Diluted |
$ |
$ |
$ |
$ |
|||||||||||
Weighted average common shares outstanding: |
|||||||||||||||
Basic |
|||||||||||||||
Diluted |
|||||||||||||||
86
PROPETRO HOLDING CORP.
NOTES TO CONSOLIDATED FINANCIAL STATEMENTS
20. SUBSEQUENT EVENTS
Stockholder Rights Plan
On April 10, 2020, the board of directors of the Company adopted a short-term stockholder rights plan (the “Rights Plan”). The Rights Plan provides for the issuance of one right for each outstanding share of the Company’s common stock held by stockholders of record on April 24, 2020. In general, the rights will become exercisable only if a person or group acquires beneficial ownership of 10 % (or 20 % in the case of certain passive investors) or more of the Company’s outstanding common stock or announces a tender or exchange offer that would result in such ownership. If the rights become exercisable, all holders of rights (other than any triggering person) will be entitled to acquire shares of common stock at a 50 % discount, or the Company may exchange each right held by such holders for one share of common stock.
The Rights Plan will expire on March 31, 2021. The Rights Plan may also be terminated, or the rights may be redeemed, prior to the scheduled expiration of the Rights Plan under certain other circumstances.
Impairments
During the first quarter of 2020, management determined the reductions in commodity prices driven by the potential impact of the novel COVID-19 virus and global supply and demand dynamics coupled with the sustained decrease in the Company’s share price were triggering events for goodwill and asset impairment. As a result of the triggering events, we performed an interim goodwill impairment test on the hydraulic fracturing reporting unit and a recoverability tests on each of the assets groups. As a result, we expect to recognize impairments and charges in the first quarter of 2020 as follows:
• |
goodwill impairment of approximately $ |
• |
drilling asset group impairment of approximately $ |
• |
write-off of $ |
If the depressed oil prices and the current economic conditions continue for a longer period of time, actual results may differ from estimates and future assumptions may change resulting in additional impairment charges in the future.
87
Item 9. Changes in and Disagreements with Accountants on Accounting and Financial Disclosure
None.
88
Item 9A. Controls and Procedures
Background
In May 2019, the Audit Committee (the “Committee”) of the Board, with assistance of independent outside counsel and accounting advisors, conducted an internal review initially focused on the Company’s disclosure of agreements previously entered into with AFGlobal Corporation for the purchase of Durastim® hydraulic fracturing fleets and effective communications related thereto. The review was later expanded (collectively referred to as the “Expanded Audit Committee Review”) to, among other items, review expense reimbursements, certain transactions involving related parties or potential conflicts of interest, and certain transactions entered into by our former Chief Executive Officer (the “former CEO”).
The Expanded Audit Committee Review did not identify any material accounting errors in the consolidated financial statements included in the 2018 Annual Report and the 2019 First Quarter 10-Q. Based on the Expanded Audit Committee Review, current management determined that there were deficiencies in the design and/or operation of internal controls that constituted material weaknesses. Current management determined that the tone from former executive management was insufficient to create the proper environment for effective internal control over financial reporting, which led to the failure of controls in other areas as further described below.
Evaluation of Disclosure Controls and Procedures
Our management, with the participation of our Principal Executive Officer and Principal Financial Officer, evaluated the effectiveness of our disclosure controls and procedures as defined in Rules 13a-15(e) and 15d-15(e) under the Exchange Act, as of December 31, 2019 and 2018, and March 31, June 30, and September 30, 2019. Previously, based on their prior evaluation, our former Principal Executive Officer and Principal Financial Officer concluded that our disclosure controls and procedures were effective as of December 31, 2018 and March 31, 2019. As a result of the material weaknesses in our internal control over financial reporting described below, our current Principal Executive Officer and Principal Financial Officer have concluded that our disclosure controls and procedures were not effective as of December 31, 2019 and 2018, and March 31, June 30, and September 30, 2019. Notwithstanding the conclusion by our Principal Executive Officer and Principal Financial Officer that our disclosure controls and procedures as of December 31, 2019 were not effective, and notwithstanding the material weaknesses in our internal control over financial reporting described below, our management has concluded that our consolidated financial statements included in each of (i) this Annual Report on Form 10-K, (ii) the 2018 Annual Report, (iii) the 2019 First Quarter 10-Q (iv) the Quarterly Report on Form 10-Q for the three months ended June 30, 2019 and (v) the Quarterly Report on Form 10-Q for the three months ended September 30, 2019, present fairly, in all material respects, our financial position, results of operations and cash flows for the periods presented in accordance with accounting principles generally accepted in the United States of America (“U.S. GAAP”).
Management’s Report on Internal Control over Financial Reporting
The management of ProPetro Holding Corp. is responsible for establishing and maintaining adequate internal control over financial reporting for the Company, as defined in Rules 13a-15(f) and 15d-15(f) under the Exchange Act. ProPetro Holding Corp. maintains a system of internal accounting controls designed to provide reasonable assurance, at a reasonable cost, that assets are safeguarded against loss or unauthorized use and that the financial records are adequate and can be relied upon to produce financial statements in accordance with U.S. GAAP. The internal control system is augmented by written policies and procedures, an internal audit program and the selection and training of qualified personnel. This system includes policies that require adherence to ethical business standards and compliance with all applicable laws and regulations.
There are inherent limitations to the effectiveness of any control system. A control system, no matter how well designed and operated, can provide only reasonable, not absolute, assurance that the objectives of the control system are met. Also, no evaluation of controls can provide absolute assurance that all control issues and instances of fraud, if any, within the Company will be detected. Further, the design of a control system must reflect the fact that there are resource constraints, and the benefits of controls must be considered relative to their costs. The Company intends to continually improve and refine its internal controls.
Our management, with the participation of our Principal Executive Officer and Principal Financial Officer, conducted an evaluation of the effectiveness of the design and operation of our internal control over financial reporting as of December 31, 2019 and 2018 based on criteria established in the 2013 Internal Control-Integrated Framework issued by COSO. Previously, based upon that evaluation by our former Principal Executive Officer and Principal Financial
89
Officer, we determined that our internal control over financial reporting was effective as of December 31, 2018. However, as discussed above and in light of the results of the Expanded Audit Committee Review, based upon the evaluation under these criteria and upon the existence of the material weaknesses described below, management, with the participation of our current Principal Executive Officer and Principal Financial Officer, determined that we did not maintain effective internal control over financial reporting as of December 31, 2019 and 2018. Due to the existence of the material weaknesses described below, our internal control over financial reporting remained ineffective as of March 31, June 30, and September 30, 2019.
A material weakness is a deficiency, or a combination of deficiencies, in internal control over financial reporting, such that a reasonable possibility exists that a material misstatement of our annual or interim financial statements would not be prevented or detected on a timely basis.
Control Environment
We have identified deficiencies in the principles associated with the control environment component of the COSO framework. Specifically, these control deficiencies constitute material weaknesses, either individually or in the aggregate, relating to the following COSO principles: (i) the organization demonstrates a commitment to integrity and ethical values, (ii) the board of directors demonstrates independence from management and exercises oversight of the development and performance of internal control, (iii) management establishes, with board oversight, structures, reporting lines, and appropriate authorities and responsibilities in pursuit of objectives, (iv) the organization demonstrates a commitment to attract, develop, and retain competent individuals in alignment with objectives, and (v) the organization holds individuals accountable for their internal control related responsibilities in the pursuit of objectives.
Our senior management did not establish and promote a control environment with an appropriate tone of compliance and control consciousness throughout the entire Company. The Company did not sufficiently promote, monitor or enforce adherence to its Code of Conduct and Ethics. Additionally, the Expanded Audit Committee Review found that there was a general lack of focus on promoting a culture of compliance within the Company. Results of poor tone at the top included: (i) certain whistleblower allegations were not properly investigated and elevated to the Committee, (ii) the lack of an employee expense review and approval policy, (iii) two instances of non-compliance with the Company’s Insider Trading Policy, and (iv) instances of non-compliance with the Code of Conduct and Ethics policies.
This material weakness in the control environment contributed to material weaknesses in the following components of the COSO framework.
Information and Communication
We have identified deficiencies in the principles associated with the information and communication component of the COSO framework. Specifically, these control deficiencies constitute material weaknesses, either individually or in the aggregate, relating to the following COSO principles: (i) the organization internally communicates information, including objectives and responsibilities for internal control, necessary to support the functioning of internal control, and (ii) the organization communicates with external parties regarding matters affecting the functioning of internal control.
Factors contributing to the material weakness included miscommunication between management and the Board regarding the conditionality of certain contracts that resulted in the non-disclosure of such contract commitments and the impact of such commitments on the Company’s future liquidity.
Control Activities
We have identified deficiencies in the principles associated with the control activities component of the COSO framework. Specifically, these control deficiencies constitute material weaknesses, either individually or in the aggregate, relating to the following COSO principles: (i) the organization selects and develops control activities that contribute to the mitigation of risks to the achievement of objectives to acceptable levels and (ii) the organization deploys control activities through policies that establish what is expected and procedures that put policies into action.
The Company’s failure to maintain appropriate tone at the top had a pervasive impact, and as such, resulted in a risk that could have impacted virtually all financial statement account balances and disclosures.
The COSO component material weaknesses described above contributed to the following material weakness within our system of internal control over financial reporting at the control activity level.
90
Related Parties
We did not maintain controls designed to sufficiently identify, evaluate, and disclose related party transactions. As a result, two related party transactions were entered into that were not identified by the Company’s controls and given consideration of appropriate disclosure.
Our independent registered public accounting firm, Deloitte & Touche LLP, has audited the consolidated financial statements as of and for the year ended December 31, 2019, and has also issued their report on the effectiveness of the Company’s internal control over financial reporting, included in this report on pages 53 and 54.
Remediation Plan and Status
Our remediation efforts are ongoing, and we will continue our initiatives to implement and document policies, procedures, and internal controls. The Board and management have implemented, among other items, the following measures to address the material weaknesses identified:
• |
Appointed new executive officers with extensive public company experience to improve the tone at the top, communication with the Board and compliance with policies within the Company. |
• |
Enhanced certain of the Company’s policies, including the Code of Ethics and Conduct, Expense Reimbursement, Travel and Entertainment, and Delegation of Responsibilities and Authority. Additionally, the Company enhanced or implemented control activities to monitor compliance with such policies. |
• |
Designed and implemented control activities related to the identification of, approval of, and disclosure of related party transactions. |
• |
Designed and implemented control activities related to the identification and approval of potential conflicts of interest. |
• |
Designed and implemented control activities related to the evaluation of whistleblower allegations. |
• |
Formed a disclosure committee and appointed a Chief Disclosure Officer to provide improved corporate governance related to disclosures the Company provides to the public and other external parties. |
Our remediation of the identified material weaknesses and strengthening our internal control environment is ongoing and will require a substantial effort. We will test the ongoing design and implementation and operating effectiveness of the new and existing controls in future periods. The material weaknesses cannot be considered remediated until the applicable controls have operated for a sufficient period of time and management has concluded, through testing, that these controls are designed and operating effectively. Accordingly, we will continue to monitor and evaluate the effectiveness of our internal control over financial reporting in the areas affected by the material weaknesses described above.
Changes in Internal Control over Financial Reporting
Except as described above, there were no changes in our system of internal control over financial reporting (as defined in Rules 13a-15(f) and 15d-15(f) under the Exchange Act) that occurred during the quarter ended December 31, 2019 that have materially affected, or are reasonably likely to materially affect, our internal control over financial reporting.
91
Item 9B. Other Information
None.
92
Part III
Item 10. Directors, Executive Officers and Corporate Governance
Below are the current directors of the Board, executive officers and certain other key officers, and certain information concerning those individuals follows the table:
Name |
Age |
Position with ProPetro Holding Corp. |
Director Since |
Executive Officer Since |
||
Phillip A. Gobe (1) |
67 |
Chief Executive Officer and Chairman of the Board |
2019 |
2019 |
||
Darin G. Holderness |
56 |
Chief Financial Officer |
2019 |
|||
David Sledge |
63 |
Chief Operating Officer |
2011 |
|||
Newton W. “Trey” Wilson III |
69 |
General Counsel and Corporate Secretary |
2019 |
|||
Elo Omavuezi |
38 |
Chief Accounting Officer |
2019 |
|||
Samuel D. Sledge (2) |
33 |
Chief Strategy and Administrative Officer |
2020 |
|||
Adam Muñoz (2) |
38 |
Senior Vice President of Operations |
2020 |
|||
Spencer D. Armour III (3) |
66 |
Director |
2013 |
|||
Mark S. Berg |
62 |
Director |
2019 |
|||
Anthony Best (4)(5)(7)(8) |
70 |
Director |
2018 |
|||
Pryor Blackwell (5)(6)(9) |
59 |
Director |
2017 |
|||
Michele V. Choka (5)(6) |
60 |
Director |
2020 |
|||
Alan E. Douglas (4)(6) |
61 |
Director |
2017 |
|||
Jack B. Moore (4)(5)(6)(10) |
66 |
Director |
2017 |
|||
(1) |
Mr. Gobe was appointed to the Board as a director and Chairman of the Board on July 11, 2019 and was subsequently appointed to the role of Executive Chairman and principal executive officer on October 3, 2019. On March 13, 2020, Mr. Gobe assumed role of Chief Executive Officer and Chairman of the Board. |
(2) |
On March 13, 2020, Mr. S. Sledge and Mr. Muñoz were promoted to the positions of Chief Strategy and Administrative Officer and Senior Vice President of Operations, respectively. |
(3) |
Mr. Armour resigned as Chairman of the Board effective July 11, 2019, but remains a member of the Board. |
(4) |
Member of the Audit Committee. |
(5) |
Member of the Compensation Committee. |
(6) |
Member of the Nominating and Corporate Governance Committee. |
(7) |
Lead Independent Director of the Board, effective October 3, 2019.
|
(8) |
Chairman of the Audit Committee.
|
(9) |
Chairman of the Compensation Committee.
|
(10) |
Chairman of the Nominating and Corporate Governance Committee.
|
Phillip A. Gobe
Phillip A. Gobe began serving as our Chairman of the Board in July of 2019. Mr. Gobe has served as Chief Executive Officer since March 13, 2020 and prior to that as our Executive Chairman since October 2019. Mr. Gobe, has served as a director of Pioneer Natural Resources Company (“Pioneer”) since July 2014. Mr. Gobe also serves as a director of Pantheon Resources plc and previously served as a director of Pioneer Southwest Energy Partners L.P. Mr. Gobe joined Energy Partners, Ltd. as Chief Operating Officer in December 2004 and became President in May 2005, and served in those capacities until his retirement in September 2007. Mr. Gobe also served as a director of Energy Partners, Ltd. from November 2005 until May 2008. Prior to that, Mr. Gobe served as Chief Operating Officer of Nuevo Energy Company from February 2001 until its acquisition by Plains Exploration & Production Company in May 2004. Prior to that time, he held numerous operations and human resources positions with Vastar Resources, Inc. and Atlantic Richfield Company and its subsidiaries. Mr. Gobe has a Bachelor of Arts degree from the University of Texas and a Master of Business Administration
93
degree from the University of Louisiana in Lafayette. Mr. Gobe’s extensive experience in the energy industry, including service as a director to public corporations in the industry, make him well suited to serve as Executive Chairman and Chairman of the Board of Directors.
Darin G. Holderness
Darin G. Holderness has served as our Chief Financial Officer since April 10, 2020 and prior to that as Interim Chief Financial Officer since October 2019. Mr Holderness, previously served as the Senior Vice President, Chief Financial Officer and Treasurer of Concho Resources Inc. (“Concho”) from May 2015 to May 2016 and served as an adviser to Concho from May 2016 to January 2017. Mr. Holderness previously served as the Senior Vice President and Chief Financial Officer of Concho from October 2012 to May 2015, the Senior Vice President, Chief Financial Officer and Treasurer from October 2010 to October 2012 and was the Vice President - Chief Financial Officer and Treasurer from August 2008 to October 2010. From May 2008 until August 2008, Mr. Holderness was employed by Eagle Rock Energy Partners, L.P. as Senior Vice President and Chief Financial Officer. From November 2004 until May 2008, Mr. Holderness served as Vice President and Chief Accounting Officer of Pioneer Natural Resources Company. Mr. Holderness currently serves as the Chairman of the board of directors and Chairman of the audit committee of Penn Virginia Corporation. Mr. Holderness holds a Bachelor of Business Administration degree in Accounting from Boise State University and is a Certified Public Accountant.
David Sledge
David Sledge has served as our Chief Operating Officer since 2011. Mr. Sledge has over 40 years of experience in the energy services industry, Mr. Sledge served on the Board of Directors for Comstock Resources, Inc. from 1996 to 2018. Prior to joining ProPetro Mr. Sledge was Vice President - Drilling for Basic Energy Services from 2007 to 2009. Mr. Sledge was President and Chief Operating Officer of Sledge Drilling Corp., which was sold to Basic Energy Services in 2007. Mr. Sledge received a B.B.A. in Management from Baylor University.
Newton W. “Trey” Wilson III
Trey Wilson has served as our General Counsel and Corporate Secretary since September 2019. Mr. Wilson served as the Chief Executive Officer of WLP/Westex Well Services & Wilson Systems from April 2018 to September 2019. Mr. Wilson previously served as the President and Chief Executive Officer of MBI Energy Services from July 2016 to March 2018. From 2005 to May 2015, Mr. Wilson served in various roles for Key Energy Services, Inc., including Executive Vice President and Chief Operating Officer and, prior to that, Senior Vice Present, General Counsel and Secretary. Mr. Wilson also served as Senior Vice Present, General Counsel and Secretary of Forest Oil Corporation from 2000 to 2005. Mr. Wilson has graduated from the Harvard Business School Executive Leadership Program, holds a Bachelor of Business Administration from Southern Methodist University, and holds a Juris Doctor from the University of Texas.
Elo Omavuezi
Elo Omavuezi has served as our Chief Accounting Officer since October 2019. Mr. Omavuezi previously served as the Director of Financial Reporting and Technical Accounting of the Company from April 2017 to October 2019. Prior to that, Mr. Omavuezi had over 10 years of accounting, internal controls and management experience serving publicly listed companies in the oilfield service and construction industries during his time with Deloitte. Mr. Omavuezi was previously employed by Deloitte as an Audit Manager from June 2014 to April 2017 and an Audit Senior from January 2007 to April 2014. Mr. Omavuezi holds a Bachelor of Science in Accounting from the University of Benin and a Master’s degree in Finance and Investment with Distinction from Brunel University and is a Certified Public Accountant.
Samuel D. Sledge
Samuel D. Sledge has served as our Chief Strategy and Administrative Officer since March 2020. Mr Sledge has significant experience with ProPetro having joined the Company in 2011. Mr. Sledge has served in various capacities throughout his tenure such as a Frac Technical Specialist and Technical Operations Manager where his duties included quality control, planning and logistics, and the development of the engineering program. Mr. Sledge has most recently served as the Vice President of Finance, Corporate Development, and Investor Relations where his responsibilities included financial planning and analysis, strategic initiatives and investor relations. Mr. Sledge received a Bachelor of Business Administration and a Masters of Business Administration from Baylor University.
94
Adam Muñoz
Adam Muñoz has served as our Senior Vice President of Operations since March 2020. Mr. Muñoz joined the Company in 2010 to initiate ProPetro’s Permian pressure pumping operation. Prior to joining ProPetro, Mr. Muñoz held sales and operations roles at Frac Tech Services and Weatherford International. Since joining ProPetro, Mr. Muñoz has served as the Director of Business Development and Technical Services where he was responsible for overseeing the growth of the hydraulic fracturing operations as well as managing the department’s day-to-day technical services. Mr. Muñoz has most recently served as the Vice President of Frac Services where his duties included leading the hydraulic fracturing division through specific efforts to increase operational efficiencies and maximize financial productivity. Mr. Muñoz received a Bachelor of Business Marketing from the University of Texas at the Permian Basin.
Spencer D. Armour III
Spencer D. Armour III has served as a member of our Board since February 2013. Mr. Armour has over 30 years of executive and entrepreneurial experience in the energy services industry. Mr. Armour served as President of PT Petroleum LLC in Midland, Texas from 2011 to 2018. He was the Vice President of Corporate Development for Basic Energy Services, Inc. from 2007 to 2008, which acquired Sledge Drilling Corp., a company Mr. Armour co‑founded and served as Chief Executive Officer from 2005 to 2006. From 1998 through 2005, he served as Executive Vice President of Patterson‑UTI Energy, Inc., which acquired Lone Star Mud, Inc., a company Mr. Armour founded and served as President from 1986 to 1997. He currently serves on the board of Viper Energy Partners, LP and the board of CES Energy Solutions Corp. Mr. Armour received a B.S. in Economics from the University of Houston in 1977 and served on the University of Houston System Board of Regents from 2011 until 2018. We believe that Mr. Armour’s extensive experience in the energy services industry and his deep knowledge of the industry dynamics within the Permian Basin make him well suited to serve as a director.
Mark S. Berg
Mark. S. Berg has served as a member of our Board since February 2019, and he was appointed to the Board by Pioneer pursuant to the Investor Rights Agreement. Mr. Berg currently serves as the Executive Vice President, Corporate Operations for Pioneer, where he serves on the Management Committee and oversees Business Development, Land, Water Management and Well Services, Government Affairs and Corporate Communications, Environmental and Sustainable Development and Facilities. Mr. Berg has fifteen years of experience with Pioneer in various roles, including as Executive Vice President & General Counsel from April 2005 to January 2014, Executive Vice President, Corporate from January 2014 to August 2015, and as Executive Vice President, Corporate/Vertically Integrated Operations until assuming his current role. He began his career in 1983 with the Houston-based law firm Vinson & Elkins L.L.P. and served as a partner from 1990 through 1997. He served as Executive Vice President, General Counsel and Secretary of American General Corporation, a Fortune 200 diversified financial services company, from 1997 through 2001. Subsequent to the sale of American General to American International Group, Mr. Berg was appointed Senior Vice President, General Counsel and Secretary of Hanover Compressor Company, a NYSE company specializing in natural gas compression and processing. Mr. Berg received his Juris Doctor, with honors, from the University of Texas School of Law, and graduated magna cum laude and Phi Beta Kappa with a Bachelor of Arts in Public Policy from Tulane University. Mr. Berg served as a member of the board of directors of HighPoint Resources Corporation from March 2018 to June 2020. We believe that Mr. Berg’s experience in significant management roles with Pioneer and his broad experience in the energy industry make him well suited to serve as a director.
95
Anthony Best
Anthony Best has served as a member of our Board since January 2018 and was elected to serve as Lead Independent Director in October 2019. Mr. Best has over 40 years of experience in the energy industry, and has served as a Senior Advisor for Quantum Energy Partners (“Quantum”) since August 2015. Prior to joining Quantum, Mr. Best served in various roles with SM Energy Company, commencing in 2006 as its President and Chief Operating Officer, and as its Chief Executive Officer from February 2007 through January 2015. From 2003 to 2005, Mr. Best served as President and Chief Executive Officer of Pure Resources, Inc., a Unocal development and exploration company. From 2000 to 2003, Mr. Best served as an independent consultant offering leadership and oil and gas consultation to energy companies and volunteer organizations, and from 1979 through 2000, Mr. Best served in various roles of increasing responsibility at Atlantic Richfield Company, culminating in the position of President, ARCO Latin America. Mr. Best holds a Master of Science in Engineering Management from the University of Alaska, and a Bachelor of Science in Mechanical Engineering from Texas A&M University. Prior to beginning his business career, Mr. Best served five years as an engineering officer in the United States Air Force. Mr. Best currently serves as the Chairman of the Board of Newpark Resources; is a director on the board of ExL Petroleum LP, a Quantum portfolio company. We believe that Mr. Best’s experience in significant management roles with companies operating in the Permian Basin and his broad experience in the energy industry make him well suited to serve as a director.
Pryor Blackwell
Pryor Blackwell has served as a member of our Board since December 2017. Mr. Blackwell has over 30 years of experience as an entrepreneur and senior executive in the commercial real estate development and investment business. Mr. Blackwell is a partner with Bandera Ventures, a private commercial real estate development and investment firm, which he co‑founded in 2003. Prior to founding Bandera Ventures, Mr. Blackwell was employed by Trammell Crow Company for 18 years where he served in numerous leadership capacities, including: President-Development & Investment Group from 2001 to 2003, Chief Operating Officer from 1998 to 2001, Chief Operating Officer-Western Operations from 1997 to 1998, Area President from 1996 to 1997, President/Chief Executive Officer-DFW from 1993 to 1997, President/Chief Executive Officer-Central Office Group from 1991 to 1993, and Partner from 1987 to 1991. Mr. Blackwell was a member of the Trammell Crow Company Executive Committee, Operating Committee, Investment Committee, and served on the Board of Directors from 1993 to 2002. Mr. Blackwell holds a Bachelor of Business Administration degree in Finance from Texas Tech University. We believe that Mr. Blackwell’s financial and investment experience provides a diverse perspective from outside the energy industry and makes him well suited to serve as a director.
Michele V. Choka
Michele V. Choka was appointed to our Board in February 2020. Ms. Choka is Vice President, Human Resources at HighPoint Resources, a successor to the Bill Barret Corporation, a development and exploratory property company, a position she has held since August 2010. Ms. Choka previously was employed at Level 3 Communications, Inc., an international communications company, starting in 2006 and ultimately as Group Vice President of Human Resources up to January 2010. Ms. Choka was also previously employed at Sun Microsystems, Inc., a computer networking company, in a variety of positions, and held senior human resource and compensation positions at Storage Technology Corporation, a data management and storage company; Electronic Data Systems Corporation, a global technology services company; and JP Morgan, a global financial services firm. Prior to joining JP Morgan, Ms. Choka served in an accounting position as a Regional Controller for the Eastern Region at Sony Corporation of America. Ms. Choka also served on the board and various committees, which included her position as Chair of the Compensation Committee, of Callidus Software Inc., a publicly-traded cloud-based software company, from September 2005 to February 2017 and Chair of the Compensation Committee and as a member of the Audit Committee, of Boingo Wireless Inc., a publicly-traded Wi-Fi company since February 2019. Ms. Choka holds a B.A. in East Asian Studies and Economics from Wesleyan University. We believe that Ms. Choka should serve as a director based on her executive leadership experience in human resources and accounting and public company board and committee experience.
Alan E. Douglas
Alan E. Douglas has served as a member of our Board since March 2017. Mr. Douglas is a shareholder of Johnson, Miller & Co. where he has worked for 25 years. Mr. Douglas is a Certified Public Accountant with over 37 years of experience in accounting and audit activities. Prior to joining Johnson, Miller & Co., Mr. Douglas was a Certified Public
96
Accountant at KPMG LLP for twelve years. Mr. Douglas received a B.B.A. in accounting from Texas Tech University. We believe that Mr. Douglas’s extensive accounting and auditing experience make him well suited to serve as a director.
Jack B. Moore
Jack B. Moore has served as a member of our Board since March 2017. Mr. Moore most recently served as President and Chief Executive Officer of Cameron International Corporation from April 2008 to October 2015 and served as Chairman of the Board of Cameron from May 2011 until it was acquired by Schlumberger in 2016. Mr. Moore served as President and Chief Operating Officer of Baker Hughes Incorporated, where he was employed for over 20 years. Mr. Moore currently serves on the University of Houston System Board of Regents and actively serves in leadership positions with the American Heart Association and Memorial Assistance Ministries. Mr. Moore is a graduate of the University of Houston with a B.B.A degree and attended the Advanced Management Program at Harvard Business School. We believe that Mr. Moore’s wealth of experience in the oilfield service sector, including service as a director and executive officer to various public corporations in the sector make him well suited to serve as a director.
CORPORATE GOVERNANCE
Board Leadership Structure
Our Board has adopted our Corporate Governance Guidelines, which is available on our website, www.propetroservices.com in the “Corporate Governance” subsection of the “Investors” section. Our Corporate Governance Guidelines provide that if the Chairman of the Board is a member of management or does not otherwise qualify as independent, the independent directors may elect a lead independent director. At present, the Board has chosen to combine the positions of Chairman and Chief Executive Officer. While the Board believes it is important to retain the flexibility to determine whether the roles of Chairman and Chief Executive Officer should be separated or combined in one individual, the Board believes that Mr. Gobe is the individual with the necessary experience, commitment and support of the other members of the Board to effectively carry out the role of Chairman.
The Board believes this structure promotes better alignment of strategic development and execution, more effective implementation of strategic initiatives and clearer accountability for the Company’s success or failure. Moreover, the Board believes that combining the Chairman and Chief Executive Officer positions does not impede independent oversight of the Company, particularly given the designation of a Lead Independent Director as discussed below. In addition, five of the eight members of the Board are independent under NYSE listing standards.
The Board designated Mr. Best, an independent director, to serve as the Lead Independent Director. In this capacity Mr. Best provides, in conjunction with the Chairman, leadership and guidance to the Board.
Lead Independent Director Responsibilities
• |
Preside over all meetings of the Board at which the Chairman of the Board is not present, including any executive sessions of the independent directors. |
• |
Approve Board meeting schedules and agendas. |
• |
Act as the liaison between the independent directors and the Chief Executive Officer and Chairman of the Board. |
Interested parties who wish to communicate with the Board, its committees, the Chairman, the Lead Independent Director or any other individual director should follow the procedures described below under “Communication with our Board of Directors.”
To facilitate candid discussion among the Company’s directors, the non-management directors meet in executive session in conjunction with each regular board meeting and as otherwise determined by the Lead Independent Director. In addition, at least once a year, the non-management directors who are independent under NYSE listing standards meet in executive session in conjunction with a regular board meeting.
97
Board of Directors and Risk Oversight
In the normal course of its business, we are exposed to a variety of risks, including market risks relating to changes in commodity prices, interest rates, political risks and credit and investment risk. The Board oversees our strategic direction, and in doing so considers the potential rewards and risks of our business opportunities and challenges, and monitors the development and management of risks that impact our strategic goals. The Audit Committee assists the Board in fulfilling its oversight responsibilities by monitoring the effectiveness of our systems of financial reporting, auditing, internal controls and legal and regulatory compliance. The Nominating and Corporate Governance Committee assists the Board in fulfilling its oversight responsibilities with respect to the management of risks associated with Board organization, membership and structure, succession planning for our directors and executive officers and corporate governance. The Compensation Committee assists the Board in fulfilling its oversight responsibilities by overseeing our compensation policies and practices. The Board does not believe that its role in the oversight of our risks affects the Board’s leadership structure.
Communicating with our Board of Directors
Stockholders and other interested parties may communicate with our Board by writing to: ProPetro Holding Corp., P.O. Box 873, Midland, Texas 79702. Stockholders may submit their communications to the Board, the independent directors, any committee of the Board or individual directors on a confidential or anonymous basis by sending the communication in a sealed envelope marked “Stockholder Communication with Directors” and clearly identifying the intended recipient(s) of the communication.
Our Secretary will review each communication and will forward the communication, as expeditiously as reasonably practicable, to the addressees if: (1) the communication complies with the requirements of any applicable policy adopted by the Board relating to the subject matter of the communication; and (2) the communication falls within the scope of matters generally considered by the Board. To the extent the subject matter of a communication relates to matters that have been delegated by the Board to a committee or to an executive officer of the Company, then our Secretary may forward the communication to the executive officer or chairman of the committee to which the matter has been delegated. The acceptance and forwarding of communications to the members of the Board or an executive officer does not imply or create any fiduciary duty of the Board members or executive officer to the person submitting the communications.
Information may be submitted confidentially and anonymously, although the Company may be obligated by law to disclose the information or identity of the person providing the information in connection with government or private legal actions and in other circumstances. The Company’s policy is not to take any adverse action, and not to tolerate any retaliation, against any person for asking questions or making good faith reports of possible violations of law, our policies or our Code of Ethics & Conduct.
Annual Meeting Attendance
While the Company does not have a specific policy about director attendance at annual meetings of stockholders, all directors are expected to attend meetings of the Board (and any committees thereof on which they serve) either in person or telephonically unless exigencies prevent them from attending. Each director attended at least 75% of the aggregate of (1) the total number of meetings of the Board (held during the period for which he or she has been a director) and (2) the total number of meetings of committees of the Board on which he or she served (during the periods that he or she served). Our non‑employee directors meet at regularly scheduled executive sessions presided over by our Chairman. Additionally, our independent directors meet at least once a year without members of management or non‑independent directors present. All of our directors attended our 2019 annual meeting of stockholders.
Compensation Committee Interlocks and Insider Participation
During the fiscal year ended December 31, 2019, the Compensation Committee was initially comprised of Steven Beal and Messrs. Best, and Blackwell. In connection with the resignation of Mr. Beal, an evaluation of committee assignments by our Nominating & Corporate Governance Committee in July 2019 was done and, our committee memberships were modified and Messrs. Best, Moore and Blackwell were appointed to, and continue to serve on, the Compensation Committee. No executive officer of the Company served as a member of the board of directors or compensation committee of any other entity that has one or more executive officers serving as a member of our Board or Compensation Committee. During the fiscal year ended December 31, 2019, Mr. Blackwell was the indirect beneficiary of certain transactions with the Company in which the amount involved exceeded $120,000.
98
Board and Committee Activity and Structure
Our Board is governed by our certificate of incorporation, bylaws, the Investor Rights Agreement, charters of the standing committees of the Board and the laws of the State of Delaware.
On December 31, 2018, we entered into the Investor Rights Agreement with an affiliate of Pioneer. The Investor Rights Agreement provides that Pioneer will be granted (i) the one‑time right to designate an independent director to the Board and (ii) the right to designate a non‑independent director to the Board for so long as Pioneer owns 5% or more of the Company’s outstanding common stock.
During 2019, our Board held twelve meetings. There are currently three standing committees of the Board: the Audit Committee, the Compensation Committee and the Nominating and Corporate Governance Committee. Members serve on these committees until their resignation or until as otherwise determined by our Board. The composition of the Board committees complies with the applicable rules of the NYSE and applicable law. Our Board has adopted a written charter for each of the standing committees, which can be found in the “Corporate Governance” subsection of the “Investors” section of our website at www.propetroservices.com.
In addition to the above governing documents, our Code of Ethics & Conduct that applies to all of our employees, as well as each member of the Board, can also be found in the “Corporate Governance” subsection of the “Investors” section of our website at www.propetroservices.com. The composition and responsibilities of each of the standing committees of our Board are as follows:
Audit Committee. Our Audit Committee is comprised solely of “independent” directors, as defined under and required by the NYSE rules and Rule 10A‑3 of the Exchange Act, as amended. Our Audit Committee is directly responsible for, among other things, the appointment, compensation, retention and oversight of our independent registered public accounting firm. The oversight of our independent registered public accounting firm includes reviewing the plans and results of the audit engagement with the firm, approving any additional professional services provided by the firm and reviewing the independence of the firm. The Audit Committee is also responsible for discussing the effectiveness of the internal controls over financial reporting with our independent registered public accounting firm and relevant financial management. During the year ended December 31, 2019, the members of the Audit Committee, at various times, were Mr. Royce Mitchell and Messrs. Beal, Best, Douglas, Gobe and Moore. Mr. Gobe ceased serving on the audit committee once he became an executive officer of the Company. In connection with the resignation of Mr. Beal and Mr. Mitchell, an evaluation of the committee assignments by our Nomination & Corporate Governance Committee was done and at present the Audit Committee is comprised of Messrs. Best, Douglas and Moore. Mr. Best serves as committee chair. Our Board has determined that Messrs. Douglas and Moore qualify as an “audit committee financial expert,” as defined by the rules under the Exchange Act. The Audit Committee held six meetings in 2019.
Nominating and Corporate Governance Committee. Our Nominating and Corporate Governance Committee consists solely of “independent” directors, as defined under and required by NYSE rules. The Nominating and Corporate Governance Committee is responsible for, among other things, identifying individuals qualified to become Board members; selecting or recommending director‑nominees for each election of directors to the Board; developing and recommending criteria for selecting qualified director candidates to the Board; considering committee member qualifications, appointments and removals; recommending corporate governance principles, codes of conduct and compliance mechanisms; providing oversight in the evaluation of the Board and each committee thereof; and developing an appropriate succession plan for our chief executive officer pursuant to our Corporate Governance Guidelines. During the year ended December 31, 2019, the members of the Nominating and Corporate Governance Committee were Messrs. Blackwell, Douglas and Moore, with Mr. Moore serving as committee chair. In connection with her appointment to the Board, Ms. Choka was also appointed to the Nominating and Corporate Governance Committee, effective February 1, 2020. The Nominating and Corporate Governance Committee held three meetings in 2019.
Compensation Committee. Our Compensation Committee consists solely of “independent” directors, as defined under and required by the NYSE rules. The Compensation Committee is responsible for, among other things, overseeing the discharge of the responsibilities of the Board relating to compensation of the Company’s officers and directors. In carrying out these responsibilities, the Compensation Committee reviews all components of executive compensation for consistency with our compensation philosophy and with the interests of our stockholders. During the fiscal year ended December 31, 2019, the members of the Compensation Committee were Messrs. Beal, Best, Moore and Blackwell. Mr. Beal stepped down
99
from the Compensation Committee in connection with his resignation in July 2019, and Ms. Choka was appointed to the Compensation Committee upon joining the Board in February of 2020. Mr. Blackwell serves as committee chair. The Compensation Committee held eight meetings in 2019.
Role of the Board, Compensation Committee and our Executive Officers
Executive compensation decisions are typically made on an annual basis by the Compensation Committee with input from our Chief Executive Officer. Specifically, after reviewing relevant market data and surveys within our industry, our Chief Executive Officer typically provides recommendations to the Compensation Committee regarding the compensation levels for our existing named executive officers and our executive compensation program as a whole. Our Chief Executive Officer generally attends all Compensation Committee meetings. After considering these recommendations, the Compensation Committee typically meets in executive session and adjusts base salary levels and non‑equity award targets. In addition, the Compensation Committee determines the achievement of non‑equity Incentive Award Plan metrics and the amount of equity awards from the Incentive Award Plan to be granted to each of our named executive officers. In making executive compensation recommendations, our Chief Executive Officer considers each named executive officer’s performance during the year, the Company’s performance during the year, as well as comparable company compensation levels. While the Compensation Committee gives considerable weight to our Chief Executive Officer’s recommendations on compensation matters, the Compensation Committee has the final decision‑making authority on all executive compensation matters.
Role of External Advisors
The Compensation Committee engaged Meridian Compensation Partners, LLC (“Meridian”) in 2019 to assist the Compensation Committee and the Board in evaluating, designing and implementing compensation practices. For the year ended December 31, 2019, Meridian received $228,142 for the services it provided to our Compensation Committee.
The Compensation Committee reviews and assesses the independence and performance of its executive compensation consultant in accordance with applicable SEC and NYSE rules and regulations on an annual basis to confirm that the consultant is independent and meets all applicable statutory and regulatory requirements.
The Audit Committee engaged Brown Rudnick LLP (“Brown Rudnick”) to perform an internal review initially focused on the Company’s disclosure of agreements previously entered into with AFGlobal Corporation for the purchase of Durastim® hydraulic fracturing fleets and effective communications related thereto. The review was later expanded to, among other items, review expense reimbursements, certain transactions involving related parties or potential conflicts of interest, and certain transactions entered into by our former Chief Executive Officer. During the year ended December 31, 2019, the Company incurred approximately $15.7 million in costs associated with Brown Rudnick associated with the internal review.
Director Nominations Process
The Nominating and Corporate Governance Committee may utilize a variety of methods for identifying potential nominees for directors, including considering potential candidates who come to their attention through current officers, directors, professional search firms or other persons. Once a potential nominee has been identified, the Nominating and Corporate Governance Committee evaluates whether the nominee has the appropriate skills and characteristics required to become a director in light of the then current make‑up of the Board. This assessment includes an evaluation of the nominee’s judgment and skills, such as experience at a strategy/policy setting level, financial sophistication, leadership and objectivity, all in the context of the perceived needs of the Board at that point in time.
In February 2019, the Board amended our Corporate Governance Guidelines to specifically take the diversity of a potential director nominee’s gender, race and ethnicity into account when considering candidates for the Board, and the Nominating and Corporate Governance Committee and the Board are committed to increasing Board diversity. One of our directors, Mr. Berg, was not recommended for nomination by the Nominating and Corporate Governance Committee, but rather was appointed pursuant to the Investor Rights Agreement. Our Board believes that at a minimum all members of the Board should have the highest professional and personal ethics and values. In addition, each member of the Board must be committed to increasing stockholder value and should have enough time to carry out his or her responsibilities as a member of the Board.
100
Our Board monitors the mix of specific experience, qualifications and skills of its directors in order to assure that the Board, as a whole, has the necessary tools to perform its oversight function effectively in light of the Company’s business and structure.
Stockholders may recommend individuals to the Nominating and Corporate Governance Committee for consideration as potential director candidates by submitting the names of the recommended individuals, together with appropriate biographical information and background materials, to the Nominating and Corporate Governance Committee, c/o Secretary, P.O. Box 873, Midland, Texas 79702. In the event there is a vacancy, and assuming that appropriate biographical and background material has been provided on a timely basis, the Nominating and Corporate Governance Committee will evaluate stockholder‑recommended candidates by following substantially the same process, and applying substantially the same criteria, as it follows for candidates submitted by others.
Director Compensation
On July 11, 2019, we approved the Amended and Restated ProPetro Holding Corp. Non-Employee Director Compensation Policy (the “Amended Director Compensation Policy”) such that each eligible non-employee director receives an annual cash retainer of $70,000. Further, the Chairperson of the Board receives an additional annual cash retainer of $50,000, and the Chairpersons of the Audit Committee, Compensation Committee and Nominating and Corporate Governance Committee receive an additional annual cash retainer of $15,000, $15,000 and $10,000, respectively. Also, pursuant to the Amended Director Compensation Policy, each non-employee director is eligible to receive an annual equity retainer with a grant date fair value of $140,000. All equity retainers consist of awards of RSUs that will vest in full on the earliest to occur of the first anniversary of the grant date, the day immediately preceding the first annual meeting of stockholders following the grant date, and the occurrence of a Change in Control, subject to continuous service through the applicable vesting date. The portion of the annual equity retainer that would have vested in the year following a non-employee director’s separation from service due to his or her death or disability will vest upon such separation from service. All annual retainers are pro-rated based on days of service for non-employee directors who join the Board during the applicable calendar year.
The equity retainer described above, which is generally granted to continuing members of the Board annually on the date of the Company’s meeting of stockholders, was granted to Mr. Gobe in connection with his appointment as Chairman of the Board, effective July 11, 2019, and was not pro-rated for his first year of service on the Board. The cash retainers described above, which are paid quarterly, were not pro-rated for Mr. Gobe for his first quarter of service on the Board. In addition to the annual retainers described above, Mr. Gobe received a $50,000 cash retainer and an equity retainer with a grant date fair value of $100,000 in connection with his appointment.
On February 1, 2020, we further amended the Amended Director Compensation Policy to include an additional annual cash retainer of $20,000 for the Lead Independent Director of the Board, to be pro-rated and paid to Mr. Best in 2020 for his service as Lead Independent Director of the Board during the fourth quarter of 2019. The members of the Board are also entitled to reimbursement of expenses incurred in connection with attendance at Board and committee meetings in accordance with Company policy.
The modifications to our director compensation program during 2019 and 2020 were intended to align our director compensation with that of our 2019 Compensation Peer Group (as defined below) and were made following the review of an analysis regarding director compensation at our 2019 Peer Group performed by Meridian.
101
The following table summarizes the compensation paid for services provided by our non-employee directors during 2019. Compensation received by Mr. Gobe for his service as both a director and as an executive officer of the Company is not included in the table below but is instead included in the tables entitled “Executive Compensation—Summary Compensation Table” and “Executive Compensation—Grants of Plan-Based Awards.”
Name |
Fees
Earned or
Paid in Cash
($)(1)
|
Stock Awards
($)(2)
|
Total
($)
|
Spencer D. Armour III |
73,831 |
139,992 |
213,823 |
Mark S. Berg (3) |
— |
— |
— |
Anthony Best |
75,226 |
139,992 |
215,218 |
Pryor Blackwell |
75,989 |
139,992 |
215,981 |
Alan E. Douglas |
63,242 |
139,992 |
203,234 |
Jack B. Moore |
73,242 |
139,992 |
213,234 |
Steven Beal |
38,052 |
139,992 |
178,044 |
Royce W. Mitchell |
27,044 |
139,992 |
167,036 |
(1) |
Reflects annual cash retainer payments made pursuant to the Amended Director Compensation Policy. With respect to Mr. Armour, this amount includes pro-rated payments associated with his service as Chairman of the Board during 2019. With respect to Messrs. Best and Beal, this amount includes pro-rated payments associated with each director’s service as Chairman of the Audit Committee during 2019. Mr. Best’s payment also includes a pro-rated payment made to him in 2020 for his service as Lead Independent Director of the Board during the fourth quarter of 2019. The amount for Mr. Mitchell is similarly pro-rated for his service during the first through third quarters of 2019. |
(2) |
Reflects the grant date fair value of RSU awards on the date of grant computed in accordance with FASB ASC Topic 718. For information regarding assumptions underlying the valuation of equity awards, see Note 14 to the Consolidated Financial Statements included in this Form 10-K. |
The following table sets forth the aggregate number of outstanding stock awards and the aggregate number of outstanding stock option awards held by each of our non-employee directors on December 31, 2019. The aggregate number of Mr. Gobe’s outstanding awards is included in the table entitled “Executive Compensation—Outstanding Equity at 2019 Fiscal Year End.”
Name |
Aggregate
Number of Stock
Awards (#)
|
Aggregate
Number of Stock
Option Awards (#)
|
Spencer D. Armour III |
7,878 |
592,774 |
Mark S. Berg |
— |
— |
Anthony Best |
7,878 |
— |
Pryor Blackwell |
7,878 |
— |
Alan E. Douglas |
7,878 |
— |
Jack B. Moore |
7,878 |
— |
Steven Beal (a) |
— |
— |
Royce W. Mitchell (a) |
— |
— |
(a) |
Messrs. Beal and Mitchell forfeited all outstanding and unvested equity awards (7,878 RSUs each) upon their resignations from the Board on July 11, 2019 and July 28, 2019, respectively. |
(3) |
Mr. Berg has elected not to be compensated for his service as a director. |
102
Responsiveness to Current Economic Environment
In light of market conditions, effective April 1, 2020, the Board approved a 15% reduction in the annual cash retainers and annual equity retainers payable to the non-employee directors pursuant to the Amended Director Compensation Policy. The additional annual cash retainers payable to non-employee directors for their service as committee chairs or lead independent director were not reduced. The Board approved these reductions after reviewing market data and receiving advice from its independent compensation consultant, Meridian, regarding reductions in director compensation in the oilfield services industry as a result of current market conditions.
Non-Employee Director Stock Ownership Guidelines
We maintain a non-employee director stock ownership policy that is applicable to all of our eligible non-employee directors. Pursuant to this policy, each non-employee director is encouraged to hold, on and following the later of the fifth anniversary of (i) the closing of our IPO and (ii) the non-employee director’s election or appointment to the Board, shares of our common stock or certain equity awards (valued based on the closing price of our common stock) with a value equal to or in excess of 300% of the non-employee director’s annual cash retainer, as such threshold may be amended by the Nominating and Corporate Governance Committee from time to time. Our IPO closed in 2017. As a result, each of the directors still have additional time to fulfill the ownership levels provided in the policy.
Delinquent Section 16(a) Reports
Section 16(a) of the Exchange Act requires our directors and executive officers, and persons who own more than 10% of our equity securities to file with the SEC initial reports of ownership and reports of changes in ownership of our common stock. Officers, directors and greater than 10% stockholders are required by SEC regulation to furnish us with copies of all Section 16(a) reports they file.
Messrs. Armour, Douglas, Mitchell, Best, Moore, Blackwell and Beal each failed to timely file a required report on Form 4 relating to the grant of restricted stock units following our 2019 annual meeting. Mr. Omavuezi timely filed a required report on Form 3, but inadvertently reported shares of common stock, which were delivered upon the vesting and settlement of RSUs that vested prior to the date of filing of the Form 3, as RSUs in Table II of the Form 3. Other than listed above, to our knowledge, our executive officers, directors and greater than 10% beneficial owners timely filed all other required Section 16(a) reports during the fiscal year ended December 31, 2019.
103
Item 11. Executive Compensation
COMPENSATION DISCUSSION AND ANALYSIS
Overview
This Compensation Discussion and Analysis (“CD&A”) describes our compensation practices and the compensation awarded to, earned by, or paid to each of our named executive officers (the “Named Executive Officers”) during the last completed fiscal year.
Named Executive Officers for 2019
For the year ended December 31, 2019, our Named Executive Officers consisted of the following:
Phillip A. Gobe (1) |
Chief Executive Officer
|
Dale Redman (2) |
Former Chief Executive Officer |
Darin G. Holderness (3) |
Chief Financial Officer |
Jeffrey D. Smith (4) |
Former Chief Administrative Officer |
David Sledge |
Chief Operating Officer |
Newton W. “Trey” Wilson III (5) |
General Counsel and Corporate Secretary |
Mark Howell (6) |
Former General Counsel and Corporate Secretary |
Ian Denholm (7) |
Former Chief Accounting Officer |
(1) |
Mr. Gobe was appointed as Executive Chairman and principal executive officer, effective as of October 3, 2019. He served in that position until his appointment as Chief Executive Officer, effective as of March 13, 2020. |
(2) |
Mr. Redman ceased to serve as principal executive officer on October 3, 2019 and resigned as Chief Executive Officer and a member of the Board on March 13, 2020. |
(3) |
Mr. Holderness was appointed to serve as Interim Chief Financial Officer as of October 3, 2019. The interim title was removed and he was appointed Chief Financial Officer effective April 10, 2020. |
(4) |
Mr. Smith served as Chief Financial Officer in 2019 until his appointment as Chief Administrative Officer on October 3, 2019. Mr. Smith was appointed as a Special Advisor to the Chief Executive Officer on March 13, 2020 and ceased serving as Chief Administrative Officer as of that date. |
(5) |
Mr. Wilson was appointed as General Counsel and Corporate Secretary, effective as of September 30, 2019. |
(6) |
Mr. Howell resigned as General Counsel and Corporate Secretary, effective as of September 29, 2019. |
(7) |
Mr. Denholm resigned as Chief Accounting Officer, effective as of October 3, 2019.
|
Compensation Philosophy and Overview
Our executive compensation program is designed to attract, motivate and retain the management talent that we believe is necessary to achieve our financial and strategic goals. Further, we believe that our executive compensation program should be appropriately tailored to balance short‑term compensation with intermediate and long‑term compensation that appropriately aligns the interests of our executives with the interests of our stockholders.
In establishing and evaluating our executive compensation programs, the Compensation Committee strives to achieve total compensation for our executives that reflects their individual contributions to the Company, responsibilities, duties and experience and is competitive with the companies with which we compete for executive talent.
104
Objectives of Our Compensation Program
Our compensation program is based on the following objectives:
Reward for Exceptional Performance and Accountability for Poor Performance. Our Named Executive Officers should be rewarded for exceptional performance and held accountable for poor performance with respect to our annual and longer-term strategic goals. Our Named Executive Officers must work to achieve these goals in a manner that is consistent with our values and policies. We satisfy this objective by tying a significant portion of each Named Executive Officer’s compensation to the achievement of financial, strategic and operational goals based on both short- and long-term corporate performance measures while retaining sufficient flexibility to modify or clawback compensation if necessary. See “Annual Cash Incentive Awards” and “Long-Term Equity Incentives” below.
Align Interests of Executives and Shareholders. Compensation for our Named Executive Officers should align their interests with those of our shareholders. Our compensation program aligns pay to performance by making a substantial portion of total executive compensation variable, or “at-risk,” through an annual bonus program based on our performance goals and the granting of long-term incentive equity awards, which include time-vested restricted stock units and performance-based restricted stock units. As performance goals are met, not met or exceeded, executives are rewarded commensurately. Our Stock Ownership Guidelines also require each Named Executive Officer to retain significant ownership in the Company’s common stock such that they are invested in our success over the long-term along with our shareholders.
Flexibility to Respond to Changing Circumstances. We are in a cyclical and volatile business. As a result, our Compensation Committee feels it is important to have a flexible compensation program that is responsive to unforeseen circumstances that arise mid-year. To meet this objective, the Compensation Committee retains discretion to increase or decrease the bonuses paid to each Named Executive Officer pursuant to the ProPetro Holding Corp. Senior Executive Incentive Plan (the “Annual Bonus Plan”) from the amount that would be indicated by the pre-established performance metrics if circumstances so warrant.
Industry Competitive. Total executive compensation should be industry-competitive so that we can attract, retain and motivate talented executives with the experience and skills necessary for our success. We satisfy this objective by staying apprised, with the assistance of the Compensation Committee’s independent compensation advisor, of the amounts and types of executive compensation paid to similarly situated executives by companies with which we compete for executive talent as well as general industry trends and best practices.
Internally Consistent and Equitable. Executive compensation should be internally consistent and equitable. We satisfy this objective by considering not only the compensation paid by our peer companies, but also our Named Executive Officers’ capabilities, levels of experience, tenures, positions, responsibilities and contributions when setting their compensation. Additionally, our Compensation Committee feels that our Named Executive Officers should have a larger proportion of their compensation at risk and tied to corporate performance because they are typically in a position to have a more direct impact on the achievement of our performance goals.
How We Make Compensation Decisions
Our Compensation Committee is responsible for establishing the elements, terms and target value of compensation paid or delivered to our Named Executive Officers but often consults the full Board with respect to material compensation actions. The Compensation Committee strives to develop a competitive, but not excessive, compensation program to recruit and retain Named Executive Officers that are among the most talented and experienced executives in our industry. An important element of the Compensation Committee’s decision making is compensation data produced by its independent compensation consultant, Meridian, including direct data from our peer group and proprietary data developed by Meridian. In addition, the Compensation Committee considers information provided by our executive officers in designing and implementing our executive compensation program. This data assists the Compensation Committee in evaluating appropriate compensation levels for each Named Executive Officer in relation to market practice and in designing an effective executive compensation program for the Company. The roles of Meridian and our executive officers in the Compensation Committee’s decision-making process are described more fully below.
Role of Compensation Consultant in Compensation Decisions
Since 2017, the Compensation Committee has retained Meridian as its independent compensation advisor. Meridian provides advice to and works with the Compensation Committee in designing and implementing the structure and mechanics of the Company’s executive compensation program as well as other matters related to officer, senior management, and director compensation and corporate governance. For example, Meridian regularly updates the Compensation Committee on regulatory changes impacting executive compensation, proxy advisor policies, and compensation-related risks. In addition, Meridian provides the Compensation Committee with relevant data, including market and peer-company compensation and performance surveys and information and advice
105
regarding trends and developments in executive and director compensation practices in our industry. This information assists the Compensation Committee in making executive and director compensation decisions based on market pay levels and best practices.
Meridian reports directly and exclusively to the Compensation Committee and does not provide any other services to management, the Company or its affiliates. Meridian does not make compensation-related decisions for the Compensation Committee or otherwise with respect to the Company, and, while the Compensation Committee generally reviews and considers information and recommendations provided by Meridian, the Compensation Committee or the Board have the only authority to make compensation-related decisions for our Named Executive Officers. The Compensation Committee has the discretion to allow Meridian to work directly with management in preparing or reviewing materials for the Compensation Committee’s consideration. During 2019, and after taking into consideration the factors listed in Section 303A.05(c)(iv) of the “NYSE” Listed Company Manual, the Compensation Committee concluded that neither it nor the Company has any conflicts of interest with Meridian, and that Meridian is independent from management. Other than Meridian, no other compensation consultants provided services to the Compensation Committee during 2019.
Role of Executive Officers in Compensation Decisions
In determining the compensation of our Named Executive Officers, the Compensation Committee considers the information and advice provided by Meridian, our corporate goals, historic and projected performance, the current economic and commodities environment, individual performance of our Named Executive Officers, and other relevant factors. With respect to the compensation of the Named Executive Officers other than our principal executive officer (initially in 2019, our Chief Executive Officer and, subsequently, our Executive Chairman), the Compensation Committee also considers the recommendations of our Chief Executive Officer or Executive Chairman. Additionally, in light of our Named Executive Officers’ integral role in establishing and executing the Company’s overall operational and financial objectives, the Compensation Committee requests that our Named Executive Officers provide the initial recommendations on the appropriate goals for the performance metrics used under our Annual Bonus Plan, and may choose to accept or modify these recommendations in its sole discretion. In addition, the Compensation Committee may invite any Named Executive Officer to attend Compensation Committee meetings to report on the Company’s progress with respect to the interim or final status of performance metrics. All Named Executive Officers are excluded from any decisions or discussions regarding their individual compensation.
Use of Peer Compensation Data
As part of its evaluation of the Company’s executive compensation practices, the Compensation Committee asked Meridian to establish a peer group of companies similar to us in industry, revenue and market capitalization and use data regarding compensation paid at each of those companies to assess competitive pay levels and executive compensation plan design.
Meridian and the Compensation Committee determined that as a result of the Company’s substantial growth since the establishment of its prior compensation peer group in 2017, changes to the Company’s compensation peer group were necessary in order to keep pay levels and pay practices aligned with the market. In late 2018, the Compensation Committee adjusted the peer group by removing several smaller and de-listed companies, and adding larger companies to the peer group in order to more appropriately reflect the Company’s financial performance and size. As a result, the Company’s peer group for purposes of aiding in establishing 2019 compensation levels (the “2019 Compensation Peer Group”) was comprised of the following companies:
Basic Energy Services, Inc. |
C&J Energy Services, Inc. |
Calfrac Well Services Ltd. |
Superior Energy Services, Inc. |
Keane Group, Inc. (1) |
FTS International Inc. |
Patterson‑UTI Energy Inc. |
Helmerich & Payne, Inc. |
Trican Well Service Ltd. |
Liberty Oilfield Services, Inc. |
Tetra Technologies, Inc. |
Newpark Resources, Inc. |
RPC, Inc. |
Oceaneering International Inc. |
Secure Energy Services, Inc. |
Mammoth Energy Services, Inc. |
(1) |
On October 31, 2019, Keane Group, Inc. merged with C&J Energy Services, Inc. and changed its name to Nextier Oilfield Solutions Inc. |
The Compensation Committee utilizes the assessment of market practices and competitive pay levels for purposes as one of many factors it considered when establishing compensation for our Named Executive Officers, certain other senior executives, and our directors but does not benchmark compensation to a specific percentile of compensation paid by our peers.
106
Elements of Compensation
Base Salary
As part of our executive compensation program, we pay a base salary to each of our executives in order to provide a consistent, minimum level of pay that is sufficient to allow us to attract and retain executives with the appropriate skills and experience for their positions. The Compensation Committee monitors and adjusts salaries for our Named Executive Officers over time as necessary to remain competitive with market rates for officers at similarly sized public companies and to reflect changes in each Named Executive Officer’s role, duties and responsibilities.
Following its annual compensation analysis, in April 2019 the Compensation Committee adjusted the base salaries for each of Messrs. Denholm and Howell, effective in April 2019, to $240,000 and $325,000, respectively, in order to ensure their base salaries were competitive with similarly situated executives at other companies in the 2019 Compensation Peer Group. The Compensation Committee did not feel modifications to base salary levels were necessary for any of the other Named Executive Officers during its annual compensation analysis in April of 2019.
Messrs. Gobe, Holderness, and Wilson were hired in the fall of 2019 and their initial base salaries were established at a level the Committee determined was appropriate given their responsibilities, experience and data regarding the pay for similarly situated executives in the 2019 Compensation Peer Group (or, for Mr. Gobe’s compensation as the Executive Chairman, the data regarding pay for similarly situated executives found in the Equilar General Industry Survey). Further, Mr. Smith’s base salary was reduced in connection with the modification of his role from Chief Financial Officer to Chief Administrative Officer in October of 2019. The following chart illustrates base salaries for our Named Executive Officers in 2018 and 2019.
2018 Base Salary |
April 2019 Base Salary |
December 2019 Base Salary |
|
Phillip A. Gobe |
N/A |
N/A |
$450,000 |
Dale Redman |
$700,000 |
$700,000 |
$700,000 |
Darin G. Holderness |
N/A |
N/A |
$500,000 |
Jeffrey D. Smith |
$500,000 |
$500,000 |
$425,000 |
David Sledge |
$425,000 |
$425,000 |
$425,000 |
Newton W. “Trey” Wilson III |
N/A |
N/A |
$400,000 |
Mark Howell |
$300,000 |
$325,000 |
N/A |
Ian Denholm |
$225,000 |
$240,000 |
N/A |
Annual Cash Incentive Awards
Annual cash incentive awards granted to our Named Executive Officers are issued pursuant to our Annual Bonus Plan and are designed to provide our Named Executive Officers with the opportunity to earn an annual cash payment based on the performance of the Company against pre-established performance metrics over the calendar year, as well as the individual performance of each executive.
Each year, the Compensation Committee establishes performance metrics and threshold, target, and maximum goals for each such metric. Potential payouts under the Annual Bonus Plan depend on the actual performance level for each metric established by the Committee, as outlined below.
Performance Level |
Payout
(as a % of
Target Bonus)
|
|
Threshold |
50% |
|
Target |
100% |
|
Maximum |
200% |
|
If performance falls between the specified performance levels, payments are determined via straight-line interpolation. If performance falls below the threshold performance level, no payments will be awarded. The Annual Bonus Plan provides the
107
Compensation Committee or the Board with the discretion to increase or decrease actual payout amounts otherwise resulting from the pre-established metrics, as it may deem necessary.
2019 Performance Measures and Determination of Payments
In March 2019, the Compensation Committee established target bonuses under the Annual Bonus Plan for each of Messrs. Redman, Smith, Sledge, Howell, and Denholm of 110%, 75%, 100%, 67%, and 52% of base salary, respectively. Mr. Smith’s target bonus was revised to 65% in connection with his appointment as Chief Administrative Officer, and his total target bonus for the year was pro-rated to reflect the time he served both as Chief Financial Officer and Chief Administrative Officer. Target bonuses for each of Messrs. Gobe, Holderness and Wilson were established at 60%, 75% and 75% of base salary, respectively, when they were hired in the fall of 2019, and pro-rated for the number of days employed by the Company during 2019. Target bonus levels for each executive were established by the Compensation Committee after reviewing peer group data (or, for the Executive Chairman, Chief Accounting Officer and Chief Administrative Officer, the compensation data found in Equilar General Industry Survey) for each position and consideration of each Named Executive Officer’s responsibility and experience. Each officer had the opportunity to earn a maximum bonus of up to 200% of such officer’s target annual bonus, subject to actual performance against the metrics established by the Compensation Committee.
Under the 2019 annual incentive program, 80% of each Named Executive Officer’s annual bonus was based on the achievement of the quantitative performance goals enumerated in the table below. The remaining 20% of the annual incentive was based upon a qualitative analysis of individual and operational performance for the 2019 fiscal year.
Measure |
Weighting |
Threshold |
Target |
Maximum |
Actual 2019 Performance |
Payout as a Percentage of Target Bonus (1) |
Quantitative Measures |
||||||
Adjusted EBITDA per Share (2) |
40% |
$3.83 |
$4.70 |
$5.26 |
5.01 |
59% |
Year‑End Net Debt to Adjusted EBITDA Ratio (3) |
20% |
0.5 |
0.25 |
0.125 |
— |
40% |
Safety-Total Recordable Incident Rate (TRIR) |
20% |
1.2 |
1.0 |
0.8 |
0.83 |
37% |
Quantitative Total |
80% |
136% |
||||
Qualitative Measure |
||||||
Individual and Operational Performance |
20% |
(4) |
0 - 40% (4) |
|||
Overall Total |
100% |
(4) |
(4) |
|||
(1) |
These amounts have been rounded to the nearest whole number.
|
(2) |
We define EBITDA as earnings before (i) interest expense, (ii) income taxes and (iii) depreciation and amortization. We define Adjusted EBITDA as EBITDA, plus (i) loss/(gain) on disposal of assets, (ii) loss/(gain) on extinguishment of debt, (iii) stock based compensation, and (iv) other unusual or non‑recurring (income)/expenses, such as impairment charges, severance, costs related to our IPO and costs related asset acquisition or one-time professional fees. |
(3) |
We define Net Debt as our total debt less our cash and cash equivalents. |
(4) |
Varies by executive. See the narrative immediately below for additional information. |
The Compensation Committee selected these performance metrics because they are important to the ongoing success of the Company and were intended to drive short-term business performance by focusing executives on key objectives that position the Company for sustained growth. Specifically, Adjusted EBITDA per share is a measure of our financial performance and capital structure, the Year End Net Debt to Adjusted EBITDA Ratio measures our liquidity and balance sheet management, and TRIR is an important measure of safety. The Qualitative component of the Annual Bonus Plan allows the Committee to assess performance across a variety of individual and operational performance factors.
Overall, the Company’s operational performance for 2019 was very strong, particularly compared with its peers. In light of strong corporate and individual executive performance, the Compensation Committee made the determination to award $150,000, $200,000, $590,000, and $120,000 under the Annual Bonus Plan to each of Messrs. Gobe, Holderness, Sledge, and Wilson, respectively. The amounts awarded to each of Messrs. Gobe and Holderness were slightly in excess (by $32,000 for Mr. Gobe and $35,000 for Mr. Holderness) of the maximum bonus resulting from the payout percentages noted in the table above (i.e., 176% of target bonus). The
108
Committee determined that such additional amounts were appropriate for these individuals in recognition of the additional time and leadership required to shepherd the internal review conducted by the Company during 2019 and the implementation of the resulting remediation and improvement plan.
As a result of the internal and disclosure control deficiencies discovered during the internal review conducted during 2019, the Compensation Committee and the Board determined it was appropriate to pay no bonuses under the Annual Bonus Plan to Messrs. Redman and Smith for the 2019 fiscal year.
Long-Term Incentive Awards
The Company maintains the Incentive Plan in order to facilitate the grant of equity incentives to directors, employees (including the Named Executive Officers) and consultants of our Company and certain of its affiliates and to enable us to obtain and retain the services of these individuals, which is essential to our long-term success. In 2019, 50% of the value of each Named Executive Officer’s long-term incentive awards were granted in the form of RSUs that vest in three substantially equal annual installments commencing on the first anniversary of the grant date and the remaining 50% in the form of PSUs that vest, if earned, following the completion of a three year performance period, in each case, subject to the Named Executive Officer’s continued employment through the end of such period. This mix of time- and performance-based awards is intended to achieve the twin goals of ensuring retention and driving performance, while aligning the interests of our Named Executive Officers with those of our shareholders by providing an opportunity for increased share holdings. Both PSUs and RSUs may be settled in shares of our common stock or in the cash equivalent of the same.
The PSUs granted in 2019 vest based on the Company’s TSR as compared to the TSR of a designated peer group of companies. For purposes of the 2019 PSU awards, recipients of PSUs may earn between 0% and 200% of the target number of shares granted, as indicated in the following table. If performance falls between the specified performance levels, payouts will be determined via straight-line interpolation. If performance falls below the threshold performance level, no payouts will be awarded. Irrespective of the payout indicated by the table below, if the Company’s TSR is below zero on an absolute basis for the performance period, the number of PSUs earned shall not be greater than the target number of PSUs granted (i.e., the payout shall not be greater than 100%).
Company’s Percentile Rank in Peer Group |
Payout
(as a % of
Target Number
of PSUs Granted)
|
Below 25th Percentile |
0% |
25th Percentile |
50% |
50th Percentile |
100% |
75th Percentile |
175% |
90th Percentile and Above |
200% |
The performance period for the 2019 PSU awards commenced on January 1, 2019 and ends on December 31, 2021. The 2019 performance peer group is comprised of the following 12 companies:
Basic Energy Services |
C&J Energy Services, Inc. |
Calfrac Well Services |
FTS International, Inc. |
Keane Group, Inc. |
Liberty Oilfield Services |
Patterson‑UTI Energy, Inc. |
U.S. Well Services |
RPC Inc. |
STEP Energy Services |
Superior Energy Services, Inc. |
Trican Well Services |
(1) |
On October 31, 2019, Keane Group, Inc. merged with C&J Energy Services, Inc. and changed its name to Nextier Oilfield Solutions Inc. |
Should a peer company cease to exist as a separate publicly-traded company during the performance period (due to an acquisition or bankruptcy, for example), it will remain as a member of the Company’s peer group, with any peer company filing for bankruptcy ranked last in the peer group, and any peer company that is acquired ranked based on the stock price at which it was acquired.
The annual value of each Named Executive Officer’s long-term incentive award is generally determined in conjunction with the Compensation Committee’s annual compensation analysis or, if later, in connection with the Named Executive Officer’s hire date following the Compensation Committee’s review of peer compensation data and consideration of each Named Executive Officer’s position and associated responsibilities. In 2019, in the Compensation Committee granted the RSUs and PSUs included in the table
109
below to our Named Executive Officers. The grant date fair value of these awards can be found in the Summary Compensation Table, below.
Name |
2019 Number of
RSUs
|
2019 Target Number of
PSUs
|
Phillip A. Gobe (1) |
9,277 |
9,277 |
Dale Redman |
88,235 |
88,235 |
Darin G. Holderness |
14,552 |
14,552 |
Jeffrey D. Smith |
29,412 |
29,412 |
David Sledge |
26,471 |
26,471 |
Newton W. “Trey” Wilson III |
14,552 |
14,552 |
Mark Howell |
18,676 |
18,676 |
Ian Denholm |
5,147 |
5,147 |
(1) |
Does not include 12,182 RSUs that Mr. Gobe received while he was a non-employee director. |
Employee Benefits and Perquisites
Health/Welfare Plans
All of our full-time employees, including our Named Executive Officers, are eligible to participate in our health and welfare plans on the same basis, including: medical, dental and vision benefits; medical and dependent care flexible spending accounts; short-term and long-term disability insurance; and group life insurance.
Retirement Plans
We currently maintain a 401(k) retirement savings plan for our employees who satisfy certain eligibility requirements. Our Named Executive Officers are eligible to participate in the 401(k) plan on the same terms as other full-time employees. Currently, we match contributions made by participants in the 401(k) plan up to a specified percentage of the employee contributions and we may make certain discretionary profit sharing contributions. Both the matching contributions and the profit sharing contributions vest in equal installments over four years of service, with accelerated vesting on retirement, death or disability. We believe that offering a vehicle for tax-deferred retirement savings through our 401(k) plan, and making matching contributions and profit sharing contributions that vest over time, add to the overall desirability of our compensation packages and further incentivize our employees in accordance with our compensation policies. We do not maintain any defined benefit pension plans or deferred compensation plans.
Perquisites
Messrs. Redman, Smith, Sledge, and Wilson each participated in a vehicle allowance program during 2019. In addition, in 2019 we provided each of Messrs. Gobe and Holderness with a Company vehicle for their use while in Midland, Texas, and paid for accommodations in Midland, Texas for Mr. Gobe during the time that he served as only the Chairman of the Board and for Mr. Holderness. Neither the Company’s cost of the vehicle allowance program for Mr. Wilson nor the cost of the total perquisites provided to Mr. Gobe reached the threshold for disclosure in the Summary Compensation Table pursuant to SEC rules, so neither are reflected in such table or the footnotes thereto. See “Executive Compensation—Summary Compensation Table.”
In 2019 the Company also provided other perquisites to its Named Executive Officers, including club memberships and dues and sporting event tickets. Finally, the Company made charitable donations on behalf of our Former Chief Executive Officer in 2019, as described below in “Executive Compensation—Summary Compensation Table.”
The Compensation Committee will review the perquisites we provide to our Named Executive Officers periodically to ensure that they are necessary to retain our executives, appropriate, and consistent with benefits offered by companies with which we compete for executive talent.
Other Compensation Policies
Consistent with our goal of aligning compensation practices with stockholder interests, the Board has adopted, and the Compensation Committee administers, an Executive Compensation Claw‑Back Policy and Executive Stock Ownership Policy.
110
Executive Compensation Claw‑Back Policy
Under the terms of our Executive Compensation Claw-Back Policy, any incentive compensation, including equity awards, paid to an executive officer which was determined based on our performance against financial metrics will be subject to recovery by the Company in the event that the underlying financial metrics are negatively impacted by a restatement of our financial statements. In addition, incentive compensation, including equity awards, is subject to recovery by the Company where an executive engages in certain misconduct.
Executive Stock Ownership Policy
Under the terms of our Executive Stock Ownership Policy, we have established equity ownership guidelines for our executive officers. Under these guidelines, the Chief Executive Officer must own shares of our common stock or certain equity awards with a value equal to not less than five times annual base pay, the Chief Financial Officer and Chief Operating Officer must own shares of our common stock or certain equity awards with a value equal to not less than three times annual base pay, and all other executive officers must own shares of our common stock or certain equity awards with a value equal to not less than one times their annual base pay. For Mr. Sledge, the deadline for compliance with these guidelines is September 11, 2023. Messrs. Gobe, Holderness, and Wilson, along with any individuals who became executive officers as a result of an internal promotion or a new hire, will have five years from the date of being named an executive officer to meet the stock ownership guidelines. Each of Messrs. Redman, Smith, Howell and Denholm ceased to be subject to these guidelines on the date he ceased to be an executive officer of the Company. In calculating the value of shares of our common stock or certain equity awards held for purposes of determining compliance with the policy, such value is equal to the closing price per share on the measurement date, based on shares owned outright and unvested RSUs, with the value of such unvested RSUs discounted by 40%. Unexercised option awards and unvested PSUs are excluded from the calculation.
No Tax Gross‑Ups
We do not provide gross‑up payments to cover our Named Executive Officers’ personal income taxes that may pertain to any of the compensation or perquisites paid or provided by our Company.
Insider Trading Compliance Policy
We believe that derivative transactions, including puts, calls and options, and hedging transactions for our securities carry a high risk of inadvertent securities laws violations and may lead to an officer, director or employee no longer having the same objectives as the Company’s other stockholders. For these reasons, we prohibit our directors, officers and employees from engaging in any type of derivative or hedging transactions in respect of our securities pursuant to our Insider Trading Compliance Policy.
Company stock pledged as collateral, including shares held in a margin account, may be sold without the consent of the holder by the lender in a foreclosure or default event, which could lead to inadvertent securities laws violations. For this reason, pursuant to our Insider Trading Compliance Policy, we prohibit pledging Company securities as collateral to secure loans and purchasing Company securities on margin.
Tax Implications
Section 162(m) of the Code generally precludes a publicly held company from taking a federal income tax deduction for compensation paid in excess of $1 million per year to certain covered employees, which include our Named Executive Officers. There was an exception to the $1 million limitation for performance-based compensation meeting certain requirements. For taxable years beginning after December 31, 2017, this exemption has been repealed for all but certain grandfathered compensation arrangements. However, a privately held corporation that becomes a publicly held corporation before December 20, 2019 may rely on the transition rules provided in Treasury Regulation Section 1.162-27(f)(1) until the earliest of the events provided in Treasury Regulation Section 1.162-27(f)(2). Because our IPO occurred in 2017, certain compensation awarded or paid prior to the expiration of the period outlined in the transition rules may be fully tax deductible. To maintain flexibility in compensating the Company’s executive officers in a manner designed to promote achievement of corporate goals, retention and recruitment, the Compensation Committee has not adopted a policy requiring all compensation to be tax deductible and expects that the deductibility of certain compensation paid will be limited by Code Section 162(m).
Compensation Risk Assessment
We believe that any risks associated with our compensation policies and practices are mitigated in large part by the following factors and, therefore, that no such risk are likely to have a material adverse effect on us:
• |
We pay a mix of compensation which includes short-term cash and long-term equity-based compensation. |
111
• |
We base the vesting and payment of our incentive compensation awards on several different performance metrics, which discourages our employees from placing undue emphasis on any one metric or aspect of our business at the expense of others. |
• |
We believe that our performance metrics are reasonably challenging, yet should not require inappropriate risk-taking to achieve. |
• |
The performance metrics for awards under our Annual Bonus Plan include quantitative financial and operational metrics as well as qualitative metrics related to our operations, strategy and other aspects of our business and our Compensation Committee retains discretion to modify payout amounts under the Annual Bonus Plan as appropriate. |
• |
The performance periods under our PSUs overlap, and our time-vested restricted stock units generally vest over a three-year period. This mitigates the motivation to maximize performance in any one period at the expense of others. |
• |
Our Named Executive Officers are required to own our common stock at levels provided in our Executive Stock Ownership Guidelines. |
• |
We have instituted a clawback policy, which allows us to clawback compensation in the event of a financial restatement or certain misconduct. |
• |
We believe that we have an effective management process for developing and executing our short- and long-term business plans. |
• |
Our compensation policies and programs are overseen by the Compensation Committee. |
• |
The Compensation Committee retains an independent compensation consultant. |
Compensation Decisions Following Fiscal Year End
Letter Agreement with Jeffrey D. Smith
On March 13, 2020, Mr. Smith was appointed as a Special Advisor to the Chief Executive Officer and will no longer serve as the Chief Administrative Officer or an executive officer of the Company. Effective as of March 13, 2020, the Company and Mr. Smith entered into a letter agreement (the “2020 Smith Letter Agreement”) memorializing the terms of his role and related matters. Pursuant to the terms of the 2020 Smith Letter Agreement, Mr. Smith will continue to receive an annualized base salary of $425,000 but the Compensation Committee does not anticipate Mr. Smith receiving any future awards under the Incentive Plan in his new role. Mr. Smith will no longer be eligible to receive an annual cash bonus under the Annual Bonus Plan, including for the 2020 fiscal year. In addition, the 2020 Smith Letter Agreement terminated the employment agreement by and between Mr. Smith and the Company dated April 17, 2013 (the “Smith Employment Agreement”), effective as of March 13, 2020, except that the restrictive covenants set forth in Section 6 of the Smith Employment Agreement will continue in full force and effect.
In addition, the 2020 Smith Letter Agreement provides Mr. Smith with the following benefits in exchange for his agreement to additional restrictive covenants that result in a total of a five-year non-competition and non-solicitation obligation (an increase from the one-year non-competition and three-year non-solicitation obligation set forth in the Smith Employment Agreement and in the award agreements documenting Mr. Smith’s equity awards under the Incentive Plan):
• |
an extension of the exercise period applicable to the stock options granted under the Stock Option Plan that are vested and outstanding as of the date of Mr. Smith’s “Termination of Employment” (as defined in the Stock Option Plan) (the “Smith Extended Options”) such that the Smith Extended Options remain exercisable until the one-year anniversary of the date of Mr. Smith’s Termination of Employment; and |
• |
“cashless exercise” of the stock options granted under the both the Stock Option Plan and Incentive Plan that are outstanding as of March 13, 2020 (the “Smith Vested Options”) within the exercise periods described in the applicable award agreements and plans (as modified by the 2020 Smith Letter Agreement for the Smith Extended Options) such that Mr. Smith does not have to deliver any cash to exercise the Smith Vested Options but the number of shares of Stock delivered by the Company upon the exercise of the Smith Vested Options shall be reduced by the number of shares of Stock equal in value to the applicable exercise price and the associated tax withholding. |
Chief Executive Officer Role
On March 13, 2020, Mr. Redman informed the Board of his intent to resign from his position as the Chief Executive Officer and as a member of the Board as of such date and entered into a separation agreement with the Company. For additional information regarding the separation agreement with Mr. Redman, please see the section below entitled “Potential Payments upon Termination and Change of Control—Actions Taken Following December 31, 2019—Redman Separation Agreement.”
112
Mr. Gobe was appointed as Chief Executive Officer effective as of March 13, 2020. Following this appointment, Mr. Gobe will no longer serve as the Company’s Executive Chairman but will continue to serve as the Company’s principal executive officer (as contemplated by Rule 13a-14 of the Exchange Act) and also continue to serve as the Chairman of the Board, a position he has held since July 11, 2019. Mr. Gobe will receive an annualized base salary of $800,000 and will be eligible (i) to receive an annual cash bonus with a target value of 100% of his base salary under the Amended Annual Bonus Plan (adjusted for 2020 to reflect his position, duties and compensation prior to and following his appointment as Chief Executive Officer), (ii) to participate in the Executive Severance Plan as a “Tier 1 Executive” and (iii) to participate in those benefit plans and programs of the Company available to similarly situated executives. Mr. Gobe also received an equity award consisting of PSUs with a grant date target value of approximately $1,320,000 and RSUs with a grant date value of approximately $880,000, in each case, under the Incentive Plan in connection with his appointment as Chief Executive Officer. Mr. Gobe’s compensation in this new role was established following the Compensation Committee’s review of data from Meridian regarding pay for similarly situated executives at our peer companies and an evaluation of his experience and importance to the organization, in particular, the role he will play in the successful implementation of the remediation and improvement plan implemented by the Company following its internal review. For additional information regarding the Executive Severance Plan please see the section below entitled “Potential Payments upon Termination and Change of Control—Actions Taken Following December 31, 2019—Executive Severance Plan.”
Chief Financial Officer Role
On April 10, 2020, the Board appointed Mr. Holderness Chief Financial Officer, removing his previous interim title. Following this appointment, Mr. Holderness will continue to serve as the Company’s principal financial officer (as contemplated by Rule 13a-14 of the Exchange Act), a position he has held since October 3, 2019. No changes to Mr. Holderness’s annual compensation were made in connection with his appointment as Chief Financial Officer. However, effective April 10, 2020, Mr. Holderness became eligible to participate in the Amended Executive Severance Plan as a “Tier 2 Executive,” as described below under “—Executive Severance Plan.” For additional information regarding the Amended Executive Severance Plan please see the section below entitled “Potential Payments upon Termination and Change of Control—Actions Taken Following December 31, 2019—Amended Executive Severance Plan.”
Annual Bonus Plan
On February 11, 2020, the Board approved the Amended and Restated ProPetro Holding Corp. Executive Incentive Bonus Plan (the “Amended Annual Bonus Plan”), which amends and restates the Annual Bonus Plan.
The Amended Annual Bonus Plan was approved to reflect changes made to the Internal Revenue Code pursuant to federal tax legislation enacted by Congress in 2017. In addition, the Amended Annual Bonus Plan makes the following changes to the Annual Bonus Plan: (i) expands the definition of “Eligible Individual” to include not only the Company’s executive officers but also senior managers of the Company, (ii) enables the Compensation Committee, as the administrator of the Amended Annual Bonus Plan, to delegate certain administrative authorities under the Amended Annual Bonus Plan to the Company’s executive officers for those participants in the Amended Annual Bonus Plan that are not executive officers of the Company, and (iii) clarifies the applicable administrator’s discretion to modify the performance goals and bonus amounts under the Amended Annual Bonus Plan.
The Amended Annual Bonus Plan governs cash incentive awards made each year to key executives and senior management members of the Company, and is effective for awards made in 2020 and thereafter. Awards under the Amended Annual Bonus Plan are tied to the achievement of performance goals, which may be based on qualitative or quantitative measures, or both, as determined by the Compensation Committee or other applicable administrator.
Cash payouts of the awards made under the Amended Annual Bonus Plan are generally made in accordance with pre-established targets, subject to the discretion of the Committee.
Executive Severance Plan
On March 13, 2020, the Board adopted the ProPetro Services, Inc. Executive Severance Plan (the “Executive Severance Plan”). The Compensation Committee and the Board adopted the Executive Severance Plan because they felt it was desirable to pivot away from individually negotiated employment agreements and towards a streamlined plan providing for more uniform treatment upon a termination of employment. The amounts of the severance and benefits established under the Executive Severance Plan were selected after the Compensation Committee received advice from Meridian regarding the types and amounts of severance that are market among the Company’s peers. The Compensation Committee also considered its members’ considerable experience in the industry when making this determination. The “Tier” level assigned to each participant in the plan was determined based on each participant’s position and responsibility.
On April 10, 2020, the Board adopted the ProPetro Services, Inc. Amended and Restated Executive Severance Plan (the “Amended Executive Severance Plan”), which amends the Executive Severance Plan such that any severance amounts that become payable will be calculated without taking into account any temporary reduction to a participant’s annualized base salary in connection
113
with a general reduction in base salaries that affects all similarly situated employees of the Company in substantially the same proportions, as determined by the Compensation Committee in its sole discretion.
Each of Messrs. Gobe, Holderness and Wilson are participants in the Amended Executive Severance Plan as are certain other executives of the Company who are not Named Executive Officers. The participation agreements for each of Messrs. Gobe, Holderness and Wilson included the termination of the Gobe Letter Agreement, the Holderness Letter Agreement and the Wilson Employment Agreement (each as defined below), respectively, except for the provisions of those agreements containing restrictive covenants. The Amended Executive Severance Plan is described in detail below, in the section entitled “Potential Payments upon Termination and Change of Control—Actions Taken Following December 31, 2019—Amended Executive Severance Plan.”
Responsiveness to Current Economic Environment
Our Named Executive Officers each volunteered for temporary reductions in base salary as a result of the current market conditions. On April 2, 2020, the Compensation Committee approved the following temporary reductions to base salaries for our Named Executive Officers, effective April 13, 2020:
• |
20% salary reduction for Mr. Gobe; |
• |
15% salary reduction for Messrs. Holderness, Sledge and Wilson; and |
• |
10% salary reduction for Mr. Smith. |
Given these reductions, the Named Executive Officers’ base salaries are as reflected in the table below:
December 31, 2019 Base Salary |
March 2020 Base Salary |
April 13, 2020 Base Salary |
|
Phillip A. Gobe |
$450,000 |
$800,000 |
$640,000 |
Dale Redman |
$700,000 |
$700,000 |
N/A |
Darin G. Holderness |
$500,000 |
$500,000 |
$425,000 |
Jeffrey D. Smith |
$425,000 |
$425,000 |
$382,500 |
David Sledge |
$425,000 |
$425,000 |
$361,250 |
Newton W. “Trey” Wilson III |
$400,000 |
$400,000 |
$340,000 |
Mark Howell |
N/A |
N/A |
N/A |
Ian Denholm |
N/A |
N/A |
N/A |
Letter Agreement with David Sledge
On April 9, 2020, the Company entered into a letter agreement with David Sledge (the “Sledge Letter Agreement”). The Sledge Letter Agreement describes a reduction in Mr. Sledge’s annualized base salary, effective April 13, 2020, which is consistent with the voluntary reduction in certain executives’ base salaries as a result of current market conditions.
The Sledge Letter Agreement also clarifies that, similar to the terms of the Amended Executive Severance Plan, Mr. Sledge’s revised annualized base salary will not be used for purposes of calculating any severance payment that Mr. Sledge may become eligible to receive pursuant to the terms of the employment agreement by and between the Company and Mr. Sledge, effective April 17, 2013 (the “Sledge Employment Agreement”). For additional information regarding the severance amounts payable to Mr. Sledge upon certain terminations of employment, please see the sections below entitled “Potential Payments upon Termination and Change of Control—Employment Agreements with Messrs. Redman, Smith and Sledge” and “Potential Payments upon Termination and Change of Control—Actions Taken Following December 31, 2019—Letter Agreement with David Sledge.”
The Sledge Letter Agreement contains Mr. Sledge’s acknowledgment of and consent to the aforementioned changes and provides that the Sledge Employment Agreement is deemed to be amended by the Sledge Letter Agreement to the extent that any provision of the Sledge Letter Agreement is inconsistent with the terms of the Sledge Letter Agreement. For additional information regarding the Sledge Employment Agreement please see the section below entitled “Narrative Disclosure to Summary Compensation Table and Grants of Plan-Based Awards Table—Employment Agreements with Messrs. Redman, Smith, Sledge and Howell.”
114
REPORT OF THE COMPENSATION COMMITTEE
The Compensation Committee has reviewed and discussed the above CD&A with management and, based on such review and discussions, the Compensation Committee recommended to the Board that the CD&A be included in this annual report on Form 10-K.
The Compensation Committee of the Board of Directors, |
|
Pryor Blackwell (Chair) |
|
Anthony Best |
|
Jack B. Moore |
|
Michele V. Choka |
|
115
EXECUTIVE COMPENSATION
Summary Compensation Table
The following table summarizes the compensation provided by us to our Named Executive Officers for the fiscal years ended December 31, 2019, 2018 and 2017.
Name and Principal Position |
Year |
Salary
($)
|
Bonus(1)
($)
|
Stock
Awards(2)
($)
|
Option
Awards(2)
($)
|
Non‑equity
incentive
plan
compensation(3)
($)
|
All Other
Compensation(4)
($)
|
Total
($)
|
|||||||
Phillip A. Gobe (5) (6) |
2019 |
142,078(8)
|
32,000 |
422,370(9)
|
— |
118,000 |
— |
714,448 |
|||||||
Chief Executive Officer |
|||||||||||||||
Dale Redman (6) |
2019 |
700,000 |
— |
4,975,572 |
— |
— |
49,336 |
5,724,908 |
|||||||
Former Chief Executive Officer |
2018 |
684,615 |
— |
3,360,534 |
— |
1,400,000 |
304,863 |
5,750,012 |
|||||||
2017 |
465,385 |
905,000 |
1,740,194 |
5,116,436 |
— |
153,370 |
8,380,385 |
||||||||
Darin G. Holderness (5) |
2019 |
159,035(10)
|
35,000 |
286,093 |
— |
165,000 |
20,725 |
665,853 |
|||||||
Chief Financial Officer |
|||||||||||||||
Jeffrey D. Smith (5) (6) |
2019 |
483,558 |
— |
1,658,543 |
— |
— |
10,800 |
2,152,901 |
|||||||
Former Chief Administrative Officer |
2018 |
500,000 |
— |
1,344,232 |
— |
750,000 |
22,732 |
2,616,964 |
|||||||
2017 |
384,615 |
575,000 |
652,592 |
3,325,090 |
20,101 |
4,957,398 |
|||||||||
David Sledge |
2019 |
425,000 |
— |
1,492,699 |
— |
590,000 |
10,800 |
2,518,499 |
|||||||
Chief Operating Officer |
2018 |
425,000 |
— |
1,209,818 |
— |
850,000 |
17,887 |
2,502,705 |
|||||||
2017 |
344,231 |
935,000 |
652,592 |
2,573,526 |
— |
10,800 |
4,516,149 |
||||||||
Newton W. “Trey” Wilson III (7) |
2019 |
96,923 |
— |
286,093 |
— |
120,000 |
— |
503,016 |
|||||||
General Counsel and Corporate Secretary |
|||||||||||||||
Mark Howell (7) |
2019 |
245,055 |
— |
1,053,139 |
— |
— |
896,594 |
2,194,788 |
|||||||
Former General Counsel and Corporate Secretary |
2018 |
284,616 |
— |
806,530 |
— |
400,000 |
1,200 |
1,492,346 |
|||||||
2017 |
197,116 |
175,000 |
435,069 |
72,863 |
— |
28,626 |
908,674 |
||||||||
Ian Denholm (5) |
2019 |
228,050 |
135,254 |
301,733 |
— |
— |
29,528 |
694,565 |
|||||||
Former Chief Accounting Officer |
2018 |
214,846 |
135,254 |
235,248 |
— |
250,000 |
— |
835,348 |
|||||||
2017 |
162,058 |
307,527 |
53,848 |
72,863 |
— |
— |
596,296 |
||||||||
(1) |
Amounts in this column for Messrs. Gobe and Holderness represent a discretionary increase to the short-term cash incentive awards paid to such Named Executive Officers pursuant to the Company’s Senior Executive Incentive Bonus Plan (the “Bonus Plan”), in each case, based upon such Named Executive Officer’s performance during 2019. See Note 3 below and “Elements of Compensation for the 2019 Fiscal Year—Annual Cash Incentive Awards” above for additional |
116
information regarding these awards. Amounts in this column for Mr. Denholm represent a bonus payable in connection with our IPO, in three installments, with the first installment payable upon our IPO and the remaining two installments payable over the following two years.
(2) |
Amounts in these columns reflect the aggregate grant date fair value of the RSU and PSU awards granted in 2019 under the Incentive Plan, calculated in accordance with FASB ASC Topic 718. For Mr. Denholm, the amount also reflects the incremental fair value of the modified awards of RSUs, PSUs and stock options as described below in “Potential Payments Upon Termination or Change in Control—Denholm Separation Agreement.” The FASB ASC Topic 718 value for the RSUs was calculated using the closing price per share of our common stock on the date of grant applied to the total number of RSUs granted. The FASB ASC Topic 718 grant date fair value of the PSUs was determined using a Monte Carlo simulation. For information regarding assumptions underlying the valuation of equity awards, see Note 14 of the Consolidated Financial Statements included in this Form 10-K. If the grant date value of the 2019 PSU awards was calculated based on the maximum possible payout, the grant date fair value for such awards for Messrs. Gobe, Redman, Holderness, Smith, Sledge, Wilson, Howell and Denholm would have been equal to $205,393, $6,144,685, $322,181, $2,048,252, and $1,843,440, $322,181, $1,300,597 and $358,437, respectively. The actual amount realized upon settlement of PSU and RSU awards will depend upon the market price of the Company’s stock on the settlement date. |
(3) |
Amounts in this column represent the short-term cash incentive awards for performance during the 2019 fiscal year pursuant to the Bonus Plan, determined based on achievement of the applicable performance metrics. Based upon performance during 2019, the Board exercised its discretion under the Bonus Plan not to pay an annual bonus to either Mr. Redman or Mr. Smith. See “Elements of Compensation for the 2019 Fiscal Year—Annual Cash Incentive Awards” above for additional informational regarding these awards. |
(4) |
As shown in the table below, amounts in this column for 2019 include the cost of the Company’s vehicle allowance program for Messrs. Redman, Smith, and Sledge, and for Mr. Holderness, the amount in this column includes the value of the Company vehicle provided to him for his use while in Midland, Texas, which was determined by multiplying the number of miles Mr. Holderness drove the vehicle in 2019 by $0.58, which is the Internal Revenue Service’s mileage reimbursement rate for business travel in 2019. For Mr. Redman, the amount reported for 2019 also includes the cost of certain other perquisites, including club dues and membership fees, charitable donations made on behalf of Mr. Redman and the cost of certain sporting event tickets purchased by the Company for Mr. Redman’s use. For Mr. Holderness, the amount reported for 2019 also includes reimbursements for travel to and from Midland, Texas (excluding any travel expenses incurred while serving as a consultant to the Company) and payment of his housing expenses in Midland, Texas. Many of the Named Executive Officers had spouses accompany them on business trips at no additional incremental cost to the Company. For Mr. Howell, the amount in this column reported for 2019 includes (i) 401(k) contributions made by ProPetro Services, Inc. (ii) cash severance and (iii) the cost of continued health coverage following his termination of employment pursuant to the Consolidated Omnibus Budget Reconciliation Act of 1985, as amended (“COBRA”), in each case of clauses (ii) and (iii), paid pursuant to the Howell Separation Agreement (as defined and described below in “Potential Payments upon Termination or Change in Control—Howell Separation Agreement”). Finally, for Mr. Denholm, the amount in this column reported for 2019 includes payment of his accrued but unused paid time off upon the Denholm Separation Date (as defined below) and cash severance paid pursuant to the Denholm Separation Agreement (as defined and described below in “Potential Payments upon Termination or Change in Control—Denholm Separation Agreement”). |
Name |
Vehicle Allowance Program
($)
|
Contribution to 401(k) Plan
($)
|
Company Vehicle Use
($)
|
Club Dues/Membership Fees
($)
|
Charitable Donations ($) |
Sporting Event Tickets
($)
|
Housing Allowance & Travel Benefits ($) |
Severance ($) |
Vacation Payout
($)
|
COBRA ($) |
Total
($)
|
|||||||||||
Phillip A. Gobe |
— |
— |
— |
— |
— |
— |
— |
— |
— |
— |
— |
|||||||||||
Dale Redman |
10,800 |
— |
— |
1,743 |
22,145 |
14,648 |
— |
— |
— |
— |
49,336 |
|||||||||||
Darin G. Holderness |
— |
— |
1,871 |
— |
— |
— |
18,854 |
— |
— |
— |
20,725 |
|||||||||||
David Sledge |
10,800 |
— |
— |
— |
— |
— |
— |
— |
— |
— |
10,800 |
|||||||||||
Jeffrey D. Smith |
10,800 |
— |
— |
— |
— |
— |
— |
— |
— |
— |
10,800 |
|||||||||||
Newton W. “Trey” Wilson III |
— |
— |
— |
— |
— |
— |
— |
— |
— |
— |
— |
|||||||||||
Mark Howell |
— |
2,769 |
— |
— |
— |
— |
— |
892,308 |
— |
1,517 |
896,594 |
|||||||||||
Ian Denholm |
— |
— |
— |
— |
— |
— |
— |
18,846 |
10,682 |
— |
29,528 |
|||||||||||
The “All Other Compensation” amounts for 2017 have been increased for Mr. Redman from $10,800 to $153,370 and for Mr. Smith from $10,800 to $20,101. The “All Other Compensation” amounts for 2018 have been increased for Mr. Redman from $19,248 to $304,863, for Mr. Smith from $16,887 to $22,732, and for Mr. Sledge from $16,887 to $17,887.
During 2019, Messrs. Redman and Smith reimbursed the Company in full for the following perquisites, which were inadvertently provided by the Company and unintentionally not disclosed in 2017 and 2018, but which are now included in the “All Other Compensation” column above for the relevant year:
• |
Mr. Redman’s 2017 perquisites have been increased to include $31,606 in plane maintenance expenses associated with personal use of his plane (which was frequently used for business travel), as well as the cost of personal travel and associated expenses, charitable donations made on behalf of Mr. Redman, medical costs and insurance, retail expenditures, sporting, movie and event tickets, subscription services, dry cleaning, meals, groceries and other supplies, which equal $38,160 in total. |
• |
Mr. Redman’s 2018 perquisites have been increased to include $97,269 in personal travel and associated expenses, $60,273 in plane maintenance expenses associated with personal use of his plane (which was frequently used for business travel), as well as the cost of charitable donations made on behalf of Mr. Redman, medical costs, retail expenditures, sporting, movie and event tickets, subscription services, dry cleaning, meals, groceries and other supplies, which equal $60,188 in total. |
• |
Mr. Smith’s 2017 and 2018 perquisite amounts have been increased to reflect the cost of his personal travel and associated expenses, retail expenditures and meals totaling $9,301 and $5,845 respectively. |
The Company determined that it also previously failed to include the following amounts in the “All Other Compensation” column for the relevant year, for which amounts the Named Executive Officers were not asked to, and did not, reimburse the Company.
• |
Mr. Redman’s 2017 perquisites have been increased to include the value of sporting and event ticket purchases, charitable donations made on behalf of Mr. Redman, and $52,665, which reflects the cost of the pilots provided by the Company for Mr. Redman’s personal use of his plane. |
117
• |
Mr. Redman’s 2018 perquisites have been increased to include the value of ticket purchases, $26,680 in charitable donations made on behalf of Mr. Redman, and $40,433, which reflects the cost of the pilots provided by the Company for Mr. Redman’s personal use of his plane. |
• |
Mr. Sledge’s 2018 perquisites have been increased to include the cost of charitable donations made on behalf of Mr. Sledge. |
The Company frequently used Mr. Redman’s personal plane for business travel and, as a result, in each of 2017 and 2018 the Company employed pilots to fly that plane. The pilots flew Mr. Redman’s plane both for personal and business flights. The perquisite amount allocable to Mr. Redman for the cost of the pilots employed by the Company was determined by (i) multiplying (A) the sum of the pilots’ salaries, the Company’s portion of the pilots’ payroll taxes and health insurance, and travel expenses incurred by the pilots on trips (e.g., the cost of lodging and meals) for each of 2017 and 2018 by (B) a fraction, the numerator of which is the total business flight hours for which the plane was used by Mr. Redman during each year and the denominator of which is the plane’s total flight hours for such year, (ii) reducing the total amount of the pilots’ expenses as set forth in clause (A) by the product determined in clause (i), and (iii) reducing the resulting difference by the amount that Mr. Redman and his affiliates reimbursed the Company for the cost of the pilots in such year. See “Narrative Disclosure to Summary Compensation Table and Grants of Plan-Based Awards Table—Perquisites” for a further description.
(5) |
On October 3, 2019, the Board appointed Messrs. Gobe, Holderness and Smith to the positions of Executive Chairman, Interim Chief Financial Officer and Chief Administrative Officer, respectively. Effective as of such date, Mr. Smith ceased to serve as the Chief Financial Officer . On April 10, 2020, Mr. Holderness was appointed Chief Financial Officer, removing the previous interim title. In addition, effective October 3, 2019, Mr. Denholm resigned from his role as Chief Accounting Officer and served as an employee of the Company until December 8, 2019. |
(6) |
Mr. Redman resigned from his position as Chief Executive Officer on March 13, 2020, and Mr. Gobe was appointed Chief Executive Officer as of such date. Effective as of the same date, Mr. Smith was appointed Senior Advisor to the Chief Executive Officer and ceased to serve as Chief Administrative Officer. |
(7) |
On August 30, 2019, Mr. Howell gave the Board notice of his intent to resign from his position as General Counsel and Corporate Secretary, effective September 29, 2019, and on September 30, 2019, the Board appointed Mr. Wilson to the office of General Counsel and Corporate Secretary. |
(8) |
This amount includes (i) $98,654 that Mr. Gobe received for his service as an executive officer and (ii) $43,424 that Mr. Gobe received for his service as Chairman of the Board prior to appointment as an executive officer . Mr. Gobe stopped receiving compensation for his service as a member of the Board upon his appointment to Executive Chairman and principal executive officer, effective October 3, 2019. |
(9) |
This amount includes the value of (i) 12,182 RSUs that Mr. Gobe received for his service on the Board in 2019, (ii) 9,277 RSUs that Mr. Gobe received for his service as an executive officer of the Company and (iii) 9,277 target PSUs that Mr. Gobe received for his service as an executive officer of the Company. For additional information, see “Grants of Plan-Based Awards” below. |
(10) |
This amount includes (i) $109,615 that Mr. Holderness received in 2019 for his service as Interim Chief Financial Officer and (ii) $49,420 that Mr. Holderness received for consulting services provided to the Company from July 2019 until his appointment as Interim Chief Financial Officer on October 3, 2019. |
118
Grants of Plan‑Based Awards
Name |
Estimated Possible Payouts
Under Non‑Equity Incentive
Plan Awards(1)
|
Estimated Future Payouts
Under Equity Incentive Plan
Awards(2)
|
All Other
Stock Awards:
Number of
Shares of Stock
|
Grant
Date
Fair Value
of Stock
and
Option Awards
|
||||||||||||||
|
Grant
Date
|
Date of Award Approval |
Threshold
($)
|
Target
($)
|
Maximum
($)
|
Threshold
(#)
|
Target
(#)
|
Maximum
(#)
|
(#)(3)
|
($)(4)
|
|||||||||
Phillip A. Gobe (5) |
7/11/2019 |
7/10/2019 |
— |
— |
— |
— |
— |
— |
12,182 |
239,985 |
||||||||
10/7/2019 |
10/3/2019 |
— |
— |
— |
— |
— |
— |
9,277 |
79,689 |
|||||||||
10/7/2019 |
10/3/2019 |
4,638 |
9,277 |
18,554 |
— |
102,696 |
||||||||||||
33,750 |
67,500 |
135,000 |
— |
— |
— |
— |
— |
|||||||||||
Dale Redman |
3/18/2019 |
2/25/2019 |
— |
— |
— |
— |
— |
— |
88,235 |
1,903,229 |
||||||||
3/18/2019 |
2/25/2019 |
— |
— |
— |
44,117 |
88,235 |
176,470 |
— |
3,072,343 |
|||||||||
385,000 |
770,000 |
1,540,000 |
— |
— |
— |
— |
— |
|||||||||||
Darin G. Holderness |
10/7/2019 |
10/3/2019 |
— |
— |
— |
— |
— |
— |
14,552 |
125,002 |
||||||||
10/7/2019 |
10/3/2019 |
— |
— |
— |
7,276 |
14,552 |
29,104 |
— |
161,091 |
|||||||||
46,875 |
93,750 |
187,500 |
— |
— |
— |
— |
— |
|||||||||||
Jeffrey D. Smith |
3/18/2019 |
2/25/2019 |
— |
— |
— |
— |
— |
— |
29,412 |
634,417 |
||||||||
3/18/2019 |
2/25/2019 |
— |
— |
— |
14,706 |
29,412 |
58,824 |
— |
1,024,126 |
|||||||||
175,157 |
350,313 |
702,626 |
— |
— |
— |
— |
— |
|||||||||||
David Sledge |
3/18/2019 |
2/25/2019 |
— |
— |
— |
— |
— |
— |
26,471 |
570,979 |
||||||||
3/18/2019 |
2/25/2019 |
— |
— |
— |
13,235 |
26,471 |
52,942 |
— |
921,720 |
|||||||||
212,500 |
425,000 |
850,000 |
— |
— |
— |
— |
— |
|||||||||||
Newton W. “Trey” Wilson III |
10/7/2019 |
10/3/2019 |
— |
— |
— |
— |
— |
— |
14,552 |
125,002 |
||||||||
10/7/2019 |
10/3/2019 |
— |
— |
— |
7,276 |
14,552 |
29,104 |
— |
161,091 |
|||||||||
37,800 |
75,600 |
151,200 |
— |
— |
— |
— |
— |
|||||||||||
Mark Howell (6) |
3/18/2019 |
2/25/2019 |
— |
— |
— |
— |
— |
— |
18,676 |
402,841 |
||||||||
3/18/2019 |
2/25/2019 |
— |
— |
— |
9,338 |
18,676 |
37,352 |
— |
650,298 |
|||||||||
110,000 |
220,000 |
440,000 |
— |
— |
— |
— |
— |
|||||||||||
Ian Denholm (7) |
3/18/2019 |
2/25/2019 |
— |
— |
— |
— |
— |
— |
5,147 |
111,021 |
||||||||
3/18/2019 |
2/25/2019 |
— |
— |
— |
2,573 |
5,147 |
10,294 |
— |
179,219 |
|||||||||
62,500 |
125,000 |
250,000 |
— |
— |
— |
— |
— |
|||||||||||
(1) |
Amounts in these columns represent the estimated payouts for annual cash incentive awards for 2019 assuming threshold, target and maximum performance achievement. For Messrs. Gobe, Holderness and Wilson, these columns represent the pro-rata portion of their annual cash incentive awards for the portion of 2019 following their respective appointments. For Mr. Smith, these columns have been adjusted to take into account the value of his potential annual cash incentive calculated based on the portion of the year he served as each of Chief Financial Officer and Chief Administrative Officer. Mr. Howell and Mr. Denholm each forfeited their annual cash incentive awards in connection with their respective terminations of employment. The actual amounts paid to our Named Executive Officers for 2019 can be found in the “Non-Equity Incentive Plan Compensation” column of the Summary Compensation Table above. See “Elements of Compensation for the 2019 Fiscal Year—Annual Cash Incentive Awards” above for additional information regarding these awards. |
(2) |
These amounts represent the threshold, target and maximum number of PSUs granted to the Named Executive Officers during 2019. The number of PSUs which ultimately vest is based on the performance of the Company’s TSR relative to the TSR of the companies in our performance peer group during the three-year performance period ending on December 31, 2021, subject to the Named Executive Officer’s continued employment through such date. The PSUs granted in 2019 were subsequently cancelled and regranted on June 4, 2020 in order to ensure the availability of an exemption from liability under Section 16(b) of Exchange Act with respect to these awards. No changes were made to the terms of the awards in connection with the cancellation and regranting of such awards other than the date of grant. |
(3) |
Other than as described in Note 5 below, amounts in this column reflect RSUs granted to the Named Executive Officers during 2019, which vest as to one-third on each of the first three anniversaries of the applicable date of grant, subject to the Named Executive Officer’s continued employment through each such date. |
(4) |
These amounts represent the aggregate grant date fair value of RSUs and PSUs granted in 2019 to the Named Executive Officers, computed in accordance with FASB ASC Topic 718, disregarding estimated forfeitures. The grant date fair value of the PSUs is based on probable outcome with regard to the applicable performance metrics. For information regarding assumptions underlying the valuation of equity awards, see Note 14 of the Consolidated Financial Statements in this Form 10-K. |
(5) |
Mr. Gobe’s award of 12,182 RSUs on July 11, 2019 was granted to Mr. Gobe pursuant to the Amended Director Compensation Policy in connection with his appointment as a member of the Board and as Chairman of the Board and will vest in full on the earliest to occur of (i) July 11, 2020, (ii) the day immediately preceding our 2020 annual meeting of stockholders and (iii) the occurrence of a Change in Control (as defined in the Incentive Plan and described below under |
119
“Potential Payments Upon Termination or Change in Control—Incentive Plan Awards”), subject to Mr. Gobe’s continued service through the applicable vesting date.
(6) |
Pursuant to the terms of the Incentive Plan, Mr. Howell forfeited all of his unvested RSUs and PSUs in connection with his September 29, 2019 separation, as described below in “Outstanding Equity Awards for Fiscal Year Ended December 31, 2019” and “Potential Payments Upon Termination or Change in Control—Howell Separation Agreement.” |
(7) |
Pursuant to the terms of the Denholm Separation Agreement (as defined and described in “Potential Payments Upon Termination or Change in Control—Denholm Separation Agreement), Mr. Denholm forfeited all of the unvested RSUs and PSUs that did not become vested in connection with his December 8, 2019 separation, as describe below in “Outstanding Equity Awards for Fiscal Year Ended December 31, 2019.” |
Narrative Disclosure to Summary Compensation Table and Grants of Plan-Based Awards Table
Employment Agreements with Messrs. Redman, Smith, Sledge and Howell
Prior to Mr. Howell’s September 29, 2019 resignation and Mr. Redman’s March 13, 2020 resignation, we were party to employment agreements with each of Messrs. Redman, Smith, Sledge and Howell. The employment agreements provide for an initial two-year term with an automatic renewal for successive one year terms unless either party gives notice of non-extension to the other no later than 90 days prior to the expiration of the then-applicable term.
The employment agreements provide for initial base salaries of $250,000 for each of Messrs. Redman, Smith, Sledge and Howell.
For Messrs. Redman, Smith and Sledge, the employment agreements provide that such Named Executive Officers will be eligible to receive an annual cash bonus in an amount up to 50% of the Named Executive Officer’s annual base salary, based upon individual and Company annual performance targets established by the Board in its sole discretion, stock option awards in connection with the IPO of the Company and four weeks of paid vacation. Pursuant to the terms of the employment agreements, the Board has the discretion to determine the amount of the annual bonuses payable based on achievement of such performance goals.
Mr. Howell’s employment agreement provides that he will be eligible to receive an annual cash bonus in an amount commensurate with other public company executive officers, based upon individual and Company annual performance targets established by the Board in its sole discretion, and equity awards on a basis commensurate with other public company executive officers. In addition, Mr. Howell’s employment agreement provided for a reimbursement for all reasonable expenses that he incurred in connection with his relocation to the Midland, Texas area. Pursuant to the terms of the employment agreement, the Board has the discretion to determine the amount of the annual bonuses payable based on achievement of such performance goals.
As described below in “Potential Payments Upon Termination or Change in Control—Employment Agreements—Employment Agreements with Messrs. Redman, Smith and Sledge,” pursuant to the employment agreements with Messrs. Redman, Smith, Sledge and Howell, upon termination of employment by the Company without Cause or by the Named Executive Officer for Good Reason, each Named Executive Officer is eligible to receive certain severance payments and benefits. Each Named Executive Officer will be required to execute a release of claims in favor of the Company in order to receive his severance benefits. The agreements also contain noncompetition covenants that apply through one year following termination of employment and non-solicitation covenants that apply through three years following termination of employment.
Employment Agreement with Mr. Wilson
On September 25, 2019, the Company entered into an employment agreement with Mr. Wilson appointing him as General Counsel and Corporate Secretary, effective September 30, 2019 (the “Wilson Employment Agreement”). The Wilson Employment Agreement provides for an initial two-year term with an automatic renewal for successive one year terms unless either party gives notice of non-extension to the other no later than 30 days prior to the expiration of the then-applicable term.
The Wilson Employment Agreement provides for (i) an annualized base salary of $400,000, (ii) eligibility to receive an annual cash bonus with a target value of 75% of Mr. Wilson’s base salary under the Bonus Plan (prorated for 2019 based on months of service as General Counsel and Corporate Secretary), (iii) cash retention bonuses equal to $25,000 each, to be paid on the first and second anniversaries of the effective date and (iv) four weeks of paid vacation.
As described below in “Potential Payments Upon Termination or Change in Control—Employment Agreements—Employment Agreement with Mr. Wilson,” pursuant to the Wilson Employment Agreement, upon termination of employment by the Company without Cause or by Mr. Wilson for Good Reason, Mr. Wilson is eligible to receive certain severance payments and benefits. Mr. Wilson will be required to execute a release of claims in favor of the Company in order to receive his severance benefits. The Wilson Employment Agreement also contains noncompetition and non-solicitation covenants that apply through one year following termination of employment.
120
Letter Agreements with Messrs. Redman and Smith
In connection with Mr. Redman’s removal as principal executive officer, the Company entered into a letter agreement with Mr. Redman effective October 3, 2019 (the “Redman Letter Agreement”). The Redman Letter Agreement describes Mr. Redman’s responsibilities, outlines the reporting relationship of each of the Company’s executive officers and includes Mr. Redman’s acknowledgment of and consent to these changes. The Redman Letter Agreement also confirms that Mr. Redman’s base salary and annual cash bonus opportunity under the Bonus Plan will remain unchanged and subject to Board discretion, and that his annual equity awards under the Incentive Plan will continue to be determined by the Compensation Committee in its sole discretion. The Redman Letter Agreement does not amend or supersede the employment agreement by and between the Company and Mr. Redman, effective April 17, 2013 (the “Redman Employment Agreement”), and confirms that the Redman Employment Agreement shall remain in full effect.
On October 3, 2019, the Company entered into a letter agreement with Mr. Smith memorializing the terms of his revised role as Chief Administrative Officer (the “Smith Letter Agreement”). The Smith Letter Agreement describes Mr. Smith’s responsibilities and compensation as Chief Administrative Officer, including (i) an annualized base salary of $425,000, (ii) eligibility to receive an annual cash bonus under the Bonus Plan with a target value of 65% of his base salary (provided, that his 2019 bonus opportunity will take into account his position, duties and compensation prior to and following his appointment as Chief Administrative Officer and will remain subject to Board discretion) and (iii) continued eligibility to receive annual equity awards under the Incentive Plan as determined by the Compensation Committee of the Board in its sole discretion. The Smith Letter Agreement contains Mr. Smith’s acknowledgment of and consent to the aforementioned changes and provides that the Smith Employment Agreement, is deemed to be amended by the Smith Letter Agreement to the extent that any provision of the Smith Employment Agreement is inconsistent with the terms of the Smith Letter Agreement.
Letter Agreements with Messrs. Gobe and Holderness
On October 3, 2019, the Company entered into a letter agreement with Mr. Gobe memorializing the terms of his role as Executive Chairman (the “Gobe Letter Agreement”). Pursuant to the Gobe Letter Agreement, Mr. Gobe will receive an annualized base salary of $450,000 and will be eligible (i) to receive an annual cash bonus with a target value of 60% of his base salary under the Bonus Plan (prorated for 2019 based on months of service as Executive Chairman) and (ii) in 2020, to receive an equity award under the Incentive Plan with a grant date target value of approximately $637,500.
On October 3, 2019, the Company also entered into a letter agreement with Mr. Holderness memorializing the terms of his role as Interim Chief Financial Officer (the “Holderness Letter Agreement”). Pursuant to the Holderness Letter Agreement, Mr. Holderness will receive an annualized base salary of $500,000 and reimbursement by the Company for reasonable expenses for temporary housing and travel incurred while performing services as Interim Chief Financial Officer. The Holderness Letter Agreement also provides that Mr. Holderness will be eligible (i) to receive an annual cash bonus under the Bonus Plan with a target value of 75% of his base salary (prorated for 2019 based on months of service as Interim Chief Financial Officer) and (ii) in 2020, to receive an equity award under the Incentive Plan with a grant date target value of approximately $1,000,000. So long as Mr. Holderness has aided in identifying, training and successfully transitioning his successor prior to his termination of employment, he will be eligible to receive a pro-rata bonus for the year in which his employment with the Company terminates, calculated based on the portion of such calendar year that he is employed by the Company and the performance of the Company for that full calendar year. See “Potential Payments Upon Termination or Change in Control—Holderness Agreements”).
Perquisites
As described in Note 4 to the Summary Compensation Table, in 2017 and 2018 the Company unintentionally provided certain perquisites to Messrs. Redman and Smith due to inadequate expense documentation associated with the Company’s expense reimbursement practices. The Company has remediated the internal and disclosure control deficiencies that led to the provision and nondisclosure of these benefits. The Company has also adopted enhanced documentation requirements and revised key internal control policies and procedures with an emphasis on transactions involving related parties or potential conflicts of interest and travel and entertainment expense reimbursement. Messrs. Redman and Smith have each reimbursed the Company for these amounts.
In addition, during 2017 and 2018, the Company provided certain sporting and event tickets to Mr. Redman, made charitable donations on behalf of Messrs. Redman and Sledge, and employed pilots to fly Mr. Redman’s personal plane for both personal and business flights, providing them with salary and health benefits. The Company did not request the Named Executive Officers to reimburse these amounts, but these perquisites are no longer provided by the Company.
The Company has increased the amounts reported in the Summary Compensation Table in the “All Other Compensation” column for each of 2017 and 2018 as appropriate and included additional disclosure in the footnotes thereto to rectify this oversight in the prior disclosures.
121
Outstanding Equity Awards for Fiscal Year Ended December 31, 2019
The following table reflects information regarding outstanding and unvested stock options, RSUs and PSUs held by our Named Executive Officers as of December 31, 2019.
Option Awards |
Stock Awards |
||||||||||||||||
Name |
Number of
Securities
Underlying
Unexercised
Options
Exercisable
(#)
|
Number of
Securities
Underlying
Unexercised
Options
Unexercisable
(#)
|
Option
Exercise
Price
($)
|
Option
Expiration
Date
|
Number of
Shares or
Units of
Stock That
Have Not
Vested(4)
(#)
|
Market
Value of
Shares or
Units of
Stock That
Have Not
Vested(5)
($)
|
Equity
Incentive
Plan Awards:
Number of
Unearned
Shares
That Have
Not Vested(6)
(#)
|
Equity
Incentive
Plan Awards:
Market Value
of Unearned
Shares
That Have
Not Vested(5)
($)
|
|||||||||
Phillip A. Gobe |
— |
— |
— |
— |
21,459 |
241,414 |
— |
— |
|||||||||
— |
— |
— |
— |
— |
— |
18,554 |
208,733 |
||||||||||
Dale Redman |
699,852(1)
|
— |
3.96 |
6/14/2023 |
— |
— |
— |
— |
|||||||||
501,540(2)
|
— |
2.25 |
7/19/2026 |
— |
— |
— |
— |
||||||||||
59,994(3)
|
59,994 |
14.00 |
3/16/2027 |
— |
— |
— |
— |
||||||||||
— |
— |
— |
— |
160,596 |
1,806,705 |
— |
— |
||||||||||
— |
— |
— |
— |
— |
— |
320,978 |
3,611,003 |
||||||||||
Darin G. Holderness |
— |
— |
— |
— |
14,552 |
163,710 |
— |
— |
|||||||||
— |
— |
— |
— |
— |
— |
29,104 |
327,420 |
||||||||||
Jeffrey D. Smith |
699,852(1)
|
— |
3.96 |
6/14/2023 |
— |
— |
— |
— |
|||||||||
310,971(2)
|
— |
2.25 |
7/19/2026 |
— |
— |
— |
— |
||||||||||
59,994(3)
|
59,994 |
14.00 |
3/16/2027 |
— |
— |
— |
— |
||||||||||
— |
— |
— |
— |
57,752 |
649,710 |
— |
— |
||||||||||
— |
— |
— |
— |
— |
— |
116,628 |
1,312,065 |
||||||||||
David Sledge |
586,755(1)
|
— |
3.96 |
6/14/2023 |
— |
— |
— |
— |
|||||||||
231,019(2)
|
— |
2.25 |
7/19/2026 |
— |
— |
— |
— |
||||||||||
59,994(3)
|
59,994 |
14.00 |
3/16/2027 |
— |
— |
— |
— |
||||||||||
— |
— |
— |
— |
52,885 |
594,956 |
— |
— |
||||||||||
— |
— |
— |
— |
— |
— |
104,966 |
1,180,868 |
||||||||||
Newton W. “Trey” Wilson III |
— |
— |
— |
— |
14,552 |
163,710 |
— |
— |
|||||||||
— |
— |
— |
— |
— |
— |
29,104 |
327,420 |
||||||||||
Mark Howell |
— |
— |
— |
— |
— |
— |
— |
— |
|||||||||
Ian Denholm |
13,869 (3)
|
— |
14.00 |
10/3/2020 |
— |
— |
— |
— |
|||||||||
(1) |
On June 14, 2013, Messrs. Redman, Smith and Sledge were each granted 699,852 options to purchase our common stock that vested in equal annual installments on June 14, 2014, June 14, 2015, June 14, 2016 and June 14, 2017. Mr. Sledge exercised a portion of such options on March 16, 2017 via “cashless exercise” such that Mr. Sledge did not have to deliver any cash to exercise such stock options but the number of shares of common stock delivered by the Company upon the exercise of such stock options was reduced by the number of shares equal to the value of the exercise price and the applicable tax withholding. |
122
(2) |
On July 19, 2016, Messrs. Redman, Smith and Sledge were granted 501,540, 310,971 and 231,019 options to purchase our common stock, respectively, that were originally scheduled to vest in equal installments December 31, 2016, June 30, 2017, December 31, 2017, June 30, 2018, and December 30, 2018. However, in connection with our IPO, we fully accelerated the vesting of the unvested portions of these options. |
(3) |
These amounts reflect option awards granted under the Incentive Plan in connection with our IPO on March 16, 2017. Such awards vest in four substantially equal annual installments commencing on the first anniversary of the grant date. In connection with Mr. Denholm’s separation and pursuant to the terms of the Denholm Separation Agreement (as defined and described below in “Potential Payments Upon Termination or Change in Control—Denholm Separation Agreement”), a pro-rata portion of the stock options granted under the Incentive Plan to Mr. Denholm vested on December 8, 2019, based on months of service during the applicable vesting period, and the exercise period for the vested stock options granted to Mr. Denholm under the Incentive Plan was extended until October 3, 2020. The remainder of Mr. Denholm’s unvested stock options were forfeited upon his separation, pursuant to the terms of the Incentive Plan and the applicable award agreement thereunder. |
(4) |
The amounts in this column represent RSU awards held by each Named Executive Officer which, other than as described for Mr. Gobe, vest pro-rata over the applicable remaining vesting dates as follows, subject to the Named Executive Officer’s continued employment: |
Name |
Number of Unvested RSUs on 12/31/2019 |
Remaining Vesting Dates |
|
Phillip A. Gobe (a) |
12,182 |
First to occur of (i) July 11, 2020, (ii) the day prior to our 2020 annual meeting of stockholders or (iii) the date of a Change in Control |
|
9,277 |
October 7, 2020, October 7, 2021 and October 7, 2022
|
||
Dale Redman |
24,191 |
June 5, 2020 |
|
48,170 |
April 18, 2020 and April 18, 2021
|
||
88,235 |
March 18, 2020, March 18, 2021 and March 18, 2022
|
||
Darin G. Holderness |
14,552 |
October 7, 2020, October 7, 2021 and October 7, 2022 |
|
Jeffrey D. Smith |
9,072 |
June 5, 2020 |
|
19,268 |
April 18, 2020 and April 18, 2021 |
||
29,412 |
March 18, 2020, March 18, 2021 and March 18, 2022
|
||
David Sledge |
9,072 |
June 5, 2020 |
|
17,342 |
April 18, 2020 and April 18, 2021 |
||
26,471 |
March 18, 2020, March 18, 2021 and March 18, 2022 |
||
Newton W. “Trey” Wilson III |
14,552 |
October 7, 2020, October 7, 2021 and October 7, 2022 |
|
(a) |
For Mr. Gobe, these amounts include a grant of RSUs made pursuant to the Amended Director Compensation Policy in connection with his appointment as a member of the Board and as Chairman of the Board on July 11, 2019. See “Director Compensation” for more information. |
Any unvested RSUs held by Mr. Howell were forfeited and cancelled in accordance with the terms of such award agreements in connection with his September 29, 2019 separation, as described below in “Potential Payments Upon Termination or Change in Control—Howell Separation Agreement.” In connection with Mr. Denholm’s separation and pursuant to the terms of the Denholm Separation Agreement (described below under “Potential Payments Upon Termination or Change in Control—Denholm Separation Agreement”), a pro-rata portion of the RSUs granted to Mr. Denholm during the 2019 calendar year were vested on December 8, 2019, based on months of service during the applicable vesting period.
(5) |
The amounts in this column were calculated by multiplying $11.25, the closing price of our common stock on December 31, 2019, by the number of awards reported. |
(6) |
Pursuant to the applicable SEC rules, the amounts in this column and in the table below reflect the maximum number of PSUs held by each Named Executive Officer which may vest, if at all, based on the performance of the Company’s stock relative to a peer group during the applicable three-year performance period as shown in the below table. The actual number of PSUs earned based on actual performance over the full performance period may range from 0% to 100% of the amount below. All outstanding PSUs, including PSUs granted in 2018 and 2019, were subsequently cancelled and regranted on June 4, 2020 in order to ensure the availability of an exemption from liability under Section 16(b) of the Exchange Act with respect to these awards. No changes were made to the terms of the awards in connection with the cancellation and regranting of such awards other than the date of grant. |
123
Name (a) |
Maximum Number of Unvested PSUs on 12/31/2019 |
Applicable Performance Period End Date |
|||
Phillip A. Gobe |
18,554 |
December 31, 2021 |
|||
Dale Redman |
144,508 |
December 31, 2020 |
|||
176,470 |
December 31, 2021 |
||||
Darin G. Holderness |
29,104 |
December 31, 2021 |
|||
Jeffrey D. Smith |
57,804 |
December 31, 2020 |
|||
58,824 |
December 31, 2021 |
||||
David Sledge |
52,024 |
December 31, 2020 |
|||
52,942 |
December 31, 2021 |
||||
Newton W. “Trey” Wilson III |
29,104 |
December 31, 2021 |
|||
(a) |
Any unvested PSUs held by Mr. Howell were forfeited and cancelled in accordance with the terms of such award agreements in connection with his September 29, 2019 separation, as described below in “Potential Payments Upon Termination or Change in Control—Howell Separation Agreement.” In connection with Mr. Denholm’s separation and pursuant to the terms of the Denholm Separation Agreement (described below under “Potential Payments Upon Termination or Change in Control—Denholm Separation Agreement”), a pro-rata portion of the PSUs granted to Mr. Denholm during the 2019 calendar year were vested on December 8, 2019, based on target performance and months of service during the applicable performance period. |
2019 Option Exercises and Stock Vested
Option Awards |
Stock Awards |
||||||||
Name |
Number of
Shares
Acquired on
Exercise
(#)
|
Value
Realized on
Exercise
($)
|
Number of
Shares
Acquired on
Vesting (1)
(#)
|
Value
Realized on
Vesting (2)
($)
|
|||||
Phillip A. Gobe |
— |
— |
— |
— |
|||||
Dale Redman |
— |
— |
120,842 |
1,829,848 |
|||||
Darin G. Holderness |
— |
— |
— |
— |
|||||
Jeffrey D. Smith |
— |
— |
45,919 |
700,494 |
|||||
David Sledge |
— |
— |
44,955 |
677,628 |
|||||
Newton III “Trey” Wilson |
— |
— |
— |
— |
|||||
Mark Howell |
— |
— |
11,828 |
247,659 |
|||||
Ian Denholm |
— |
— |
9,449 |
125,253 |
|||||
(1) |
This column reflects the RSUs and PSUs held by each Named Executive Officer that vested during 2019, except as noted below for Mr. Denholm. The target number of PSUs granted to the Named Executive Officers in 2017 vested. For Messrs. Howell and Denholm, this column reflects the RSUs held each Named Executive Officer that vested in accordance with their applicable vesting schedules prior to their respective separations. For Mr. Denholm, this amount also includes the accelerated vesting of certain of his outstanding RSUs and PSUs, based up target performance, as provided for in the Denholm Separation Agreement and as described below under “Potential Payments Upon Termination or Change in Control—Denholm Separation Agreement.” |
(2) |
This column reflects the aggregate market value realized by each Named Executive Officer upon vesting, calculated by multiplying the number of RSUs and PSUs that vested (including shares withheld for tax withholding purposes) by the closing price of our common stock on the applicable vesting date. |
Pension Benefits
We do not sponsor any qualified or non‑qualified defined benefit pension plans.
124
Nonqualified Deferred Compensation
We do not have any non‑qualified deferred compensation plans.
Potential Payments upon Termination or Change in Control
Employment Agreements
On December 31, 2019, we were party to employment agreements with each of Messrs. Redman, Smith, Sledge and Wilson. Prior to his September 29, 2019 resignation, we were also party to an employment agreement with Mr. Howell, but his severance amounts were not determined in accordance with his employment agreement and are described below under “—Howell Separation Agreement.” As of December 31, 2019, none of our other Named Executive Officers are party to an employment agreement or any other agreement that provides for severance payments or benefits. As of the filing of this Annual Report, we were not a party to any employment or letter agreements with any of our Named Executive Officers, other than Mr. Sledge, that provide for severance payments or benefits. Certain of our Named Executive Officers are participants in the Executive Severance Plan, which is described in detail below in the sub-section entitled “Actions Taken Following December 31, 2019.”
Employment Agreements with Messrs. Redman, Smith and Sledge
The employment agreements with Messrs. Redman, Smith and Sledge provide such Named Executive Officers with the following severance payments and benefits upon their termination of employment without “Cause” or resignation for “Good Reason” (each as defined below):
• |
Lump sum payment equal to the amount of earned but unpaid base salary, reimbursement for all incurred but unreimbursed expenses and the value of all accrued but unused vacation (the “Standard Accrued Amounts”); |
• |
One times the sum of (i) the Named Executive Officer’s current annualized base salary and (ii) the amount of the Named Executive Officer’s annual bonus paid for the year prior to the year of termination, payable in equal installments in accordance with normal payroll practices for the 12 months following the termination date; |
• |
Payment of any earned but unpaid annual bonus for the year prior to the year of the termination, payable at the time such bonuses are paid to other executives; and |
• |
Reimbursement for the excess of the premiums for continued health coverage for the Named Executive Officer, his spouse and his eligible dependents under the Company’s group health plans in accordance with COBRA over the current employee rates for up to 12 months, or if earlier, the date that the Named Executive Officer becomes covered under another employer’s group health plans. |
To receive the above described severance payments and benefits, each Named Executive Officer must execute a release of claims in favor of the Company and comply with the terms of his employment agreement, including a one-year non-competition and three-year non-solicitation obligation as well as a perpetual confidentiality and non-disparagement obligation.
Only the Standard Accrued Amounts are payable in the event of the Named Executive Officer’s termination due to his death or “Disability” (as defined below), and the Named Executive Officers are not entitled to enhanced severance payments or benefits upon termination in connection with or following a change in control.
As used in the employment agreements with Messrs. Redman, Smith and Sledge, the following terms generally mean:
• |
“Cause” generally means the Named Executive Officer’s (i) willful failure or refusal (other than due to Disability) to perform obligations or any lawful directive from the Board, subject to a 30-day cure period, (ii) commission, conviction, plea of no contest, plea of nolo contendere or imposition of unadjudicated probation for any felony or crime involving moral turpitude, (iii) unlawful use or possession of illegal drugs on the Company’s premises or while performing duties, (iv) fraud, embezzlement, misappropriation, misconduct, conversion of assets of the Company or breach of fiduciary duty or (v) material breach of the employment agreement or any agreement with the Company or its affiliates, subject to a 30-day cure period.
|
• |
“Good Reason” generally means (i) the material diminution in the Named Executive Officer’s base salary, authority, duties, or responsibilities or (ii) the material breach by the Company of any of its obligations under the employment agreement, in each case, subject to a 90-day notice period, 30-day cure period and the Named Executive Officer’s resignation within six months of the end of the cure period. |
125
• |
“Disability” generally means the Named Executive Officer’s inability to engage in substantial gainful activity by reason of any medically determinable physical or mental impairment that can be expected to result in death or last for at least 12 continuous months. |
Employment Agreement with Mr. Wilson
On September 25, 2019, we entered into the Wilson Employment Agreement that provides Mr. Wilson with the following severance payments and benefits upon his termination of employment without “Cause” or resignation for “Good Reason” (each as defined below):
• |
Lump sum payment equal to the amount of earned but unpaid base salary (the “Wilson Accrued Amounts”); and |
• |
One times (or, if such termination or resignation, as applicable, occurs within 12 months following a “Change in Control” (as defined in the Incentive Plan and as described below), one and one half times) the sum of (i) the Mr. Wilson’s then-current annualized base salary and (ii) the target amount of Mr. Wilson’s annual bonus for the year of the termination, payable in equal installments in accordance with normal payroll practices for the 12 months following the termination date. |
To receive the above described severance payments and benefits, Mr. Wilson must execute a release of claims in favor of the Company and comply with the terms of the Wilson Employment Agreement, including a one-year non-competition and one-year non-solicitation obligation as well as a perpetual confidentiality obligation.
Only the Wilson Accrued Amounts are payable in the event of the Mr. Wilson’s termination due to his death or “Disability” (as defined below).
As used in the Wilson Employment Agreement, the following terms generally mean:
• |
“Cause” generally means Mr. Wilson’s (i) material breach of the employment agreement or any other agreement with the Company or its affiliates, subject to a 30-day notice and 15-day cure period, (ii) material breach of the Company’s or its affiliates’ policies or code of conduct applicable to Mr. Wilson, subject to a 30-day notice and 15-day cure period, (iii) material breach of any law applicable to the workplace or employment relationship, subject to a 30-day notice and 15-day cure period, (iv) gross negligence, material misconduct reflecting negatively on the Company, breach of fiduciary duty, fraud, theft or embezzlement, (v) conviction of or plea of nolo contendere to any felony (or state law equivalent) or any crime involving moral turpitude, (vi) material failure or refusal (other than due to Disability) to perform obligations or any lawful director from the Board or the Company’s principal executive officer, subject to a 30-day notice and 15-day cure period, (vii) unlawful use or possession of illegal drugs on the Company’s premises or while performing duties, (viii) failure to exercise the degree of care, skill and diligence as lawyers of ordinary skill and knowledge commonly possess and exercise or failure to act with undivided loyalty to the Company and its affiliates, subject to a 30-day notice and 15-day cure period, or (ix) failure to maintain a license to practice law in the state of Texas or failure to maintain good standing with the State Bar of Texas.
|
• |
“Good Reason” generally means (i) the material diminution in Mr. Wilson’s base salary, authority, duties, or responsibilities (provided that his removal from the board of directors or as an officer of any of the Company’s affiliates shall not constitute Good Reason), (ii) the material breach by the Company of any of its obligations under the employment agreement or (iii) Mr. Wilson’s relocation by more than 50 miles from his current place of business, in each case, subject to a 30-day notice period, 15-day cure period and Mr. Wilson’s resignation within 75 days of the end of the cure period. |
• |
“Disability” generally means Mr. Wilson’s inability to perform the essential functions of his job due to physical or mental impairment for a period that exceeds 120 consecutive days or 180 total days in any 12-month period, as determined by the Board. |
Holderness Agreements
On October 3, 2019, we entered into the Holderness Letter Agreement that provides Mr. Holderness with the eligibility to receive a pro-rata bonus for the year in which his employment with the Company terminates, calculated based on the portion of such calendar year that he is employed by the Company and the performance of the Company for that full calendar year and payable at the time that such annual bonuses are paid to other executives. The pro-rata bonus is only payable upon Mr. Holderness’s termination of employment if Mr. Holderness is deemed a “good leaver” (as defined below).
In addition, Mr. Holderness’s 2019 award agreements under the Incentive Plan provide Mr. Holderness with the following upon his termination of employment if Mr. Holderness is deemed a good leaver:
126
• |
Accelerated vesting of a pro-rata number of RSUs, calculated based on the number of days Mr. Holderness was employed by the Company during the applicable vesting period; and |
• |
Deemed satisfaction of the applicable service requirement with respect to a pro-rata number of PSUs, calculated based on the number of days employed by the Company during the applicable performance period, which remain outstanding and eligible to vest subject to satisfaction of the applicable performance metrics through the end of the applicable performance period. |
To receive the above described severance payments and benefits, Mr. Holderness must execute a release of claims in favor of the Company and comply with the terms of the Holderness Letter Agreement and Mr. Holderness’s award agreements under the Incentive Plan, including a one-year non-competition and two-year non-solicitation obligation as well as a perpetual confidentiality obligation.
In the event of the Mr. Holderness’s termination due to his death, “Disability” or “Retirement” (each as defined below in “—Incentive Plan Awards”), his RSU and PSU awards will be treated in accordance with the terms of the Incentive Plan, as described below in “—Incentive Plan Awards.”
As used in the Holderness Letter Agreement and in the RSU and PSU award agreements with Mr. Holderness, “good leaver” generally means that Mr. Holderness has aided in identifying, training and successfully transitioning his successor prior to his termination of service.
Stock Option Plan Awards
The stock options granted under the Stock Option Plan are fully vested. The vested and outstanding stock options awarded under the Stock Option Plan will remain outstanding and exercisable for 90 days following a Named Executive Officer’s termination of service without “Cause” or due to his resignation for “Good Reason” and will remain outstanding and exercisable for 12 months following a Named Executive Officer’s termination of service due to his death or “Disability.”
Only Messrs. Redman, Smith and Sledge hold stock options under the Stock Option Plan, and “Cause,” “Good Reason” and “Disability” are each as defined under their employment agreements for purposes of the Stock Option Plan.
Incentive Plan Awards
Mr. Holderness’s equity awards under the Incentive Plan are governed by the terms of the award agreements for Mr. Holderness described above under “—Holderness Agreements.” All other Named Executive Officers’ equity awards are subject to the following terms.
Pursuant to the Incentive Plan, in the event of a termination of employment of a Named Executive Officer due to his death, "Disability” or “Retirement,” (i) all unvested RSUs and stock options that would have vested had the Named Executive Officer continued his service during the 12 months following the termination will vest on such termination or resignation date, and (ii) with respect to any unvested PSUs, if such termination of employment occurs within one year prior to the last day of the applicable performance period, the Named Executive Officer’s unvested PSUs will remain outstanding and eligible to vest at the end of the applicable performance period.
In the event of a termination of a Named Executive Officer by the Company without “Cause” upon or within one year following a “Change in Control,” all unvested RSUs, stock options and PSUs will immediately vest based on performance as of the date of the Change in Control. In the event of a termination of employment of a Named Executive Officer for any other reason, all unvested RSUs and PSUs will be forfeited immediately upon the termination.
Mr. Gobe’s RSUs received for his service as a director under the Incentive Plan shall vest in full upon a Change in Control. Otherwise, such RSUs are governed by the terms set forth above. All of Mr. Gobe’s equity awards received for his service as an executive officer under the Incentive Plan shall be governed in accordance with the terms set forth above.
To receive the above described severance payments and benefits, the Named Executive Officers must execute a release of claims in favor of the Company and comply with the terms of certain restrictive covenants, including a one-year non-competition and two-year non-solicitation obligation as well as a perpetual confidentiality and non-disparagement obligations.
As used in the Incentive Plan and the award agreements thereunder, “Cause” and “Disability” have the meaning set forth in each Named Executive Officer’s employment agreement, or, if none, generally have the meanings set forth below. In addition, “Retirement” and “Change in Control” generally have the meanings set forth below.
• |
“Cause” generally means the Named Executive Officer’s (i) willful failure to substantially perform his duties, (ii) willful failure to carry out, or comply with, in any material respect any lawful directive of our board of directors, (iii) commission at |
127
any time of any act or omission that results in, or may reasonably be expected to result in, a conviction, a plea of no contest, plea of nolo contendere or imposition of unadjudicated probation for any felony or crime involving moral turpitude, (iv) unlawful use (including being under the influence) or possession of illegal drugs on the Company’s premises or while performing his duties and responsibilities, (v) commission at any time of any act of fraud, embezzlement, misappropriation, misconduct, conversion of assets of the Company or breach of fiduciary duty against the Company or (vi) material breach of the employment agreement or any other agreement with the Company, subject to certain procedural requirements.
• |
“Change of Control” generally means (i) any transaction or series of transactions whereby any person, other than the Company, any of its subsidiaries or any Company benefit plan, acquires beneficial ownership of 30% or more of the total combined voting power of the Company’s securities, (ii) the current members of the Board cease to constitute a majority of the Board for any reason, (iii) the consummation by the Company of a merger, consolidation, reorganization or business combination or a sale of all or substantially all of the Company’s assets, unless (a) the Company controls the successor entity, (b) no person owns 50% or more of the combined voting power of the successor entity or (c) the current members of the Board represent the majority of the successor entity’s board or (iv) the tenth day following the complete dissolution of the Company. |
• |
“Disability” generally means the Named Executive Officer’s inability to engage in substantial gainful activity by reason of any medically determinable physical or mental impairment. |
• |
“Retirement” generally means the termination of the Named Executive Officer’s employment following his attainment of both (i) age 60 and (ii) ten years of service with the Company or one of its affiliates. |
Quantification of Benefits on Termination
The table below quantifies the payments and benefits that would have been paid to our Named Executive Officers pursuant to the terms of the employment agreements and equity award agreements in the event of certain terminations of employment with us, had such terminations occurred on December 31, 2019.
Name |
Termination without Cause or Resignation for Good Reason (1) ($) |
Termination as a Result of Death, Disability or Retirement (2) ($) |
Termination Without Cause Within One Year Following a Change in Control (3)
($)
|
Resignation for Good Reason Within One Year Following a Change in Control (3)
($)
|
||||
Phillip A. Gobe |
||||||||
Cash Severance (4) |
— |
— |
— |
— |
||||
Pro-Rata Bonus (5) |
— |
— |
— |
— |
||||
COBRA Subsidy (6) |
— |
— |
— |
— |
||||
RSU & PSU Acceleration (7) |
— |
171,833 |
345,780 |
137,048 |
||||
Stock Option Acceleration (7) |
— |
— |
— |
— |
||||
Total |
— |
171,833 |
345,780 |
137,048 |
||||
Dale Redman |
||||||||
Cash Severance (4) |
2,100,000 |
— |
2,100,000 |
2,100,000 |
||||
Pro-Rata Bonus (5) |
— |
— |
— |
— |
||||
COBRA Subsidy (6) |
5,976 |
— |
5,976 |
5,976 |
||||
RSU & PSU Acceleration (7) |
— |
1,687,961 |
3,612,206 |
— |
||||
Stock Option Acceleration (7) |
— |
— |
||||||
Total |
2,105,976 |
1,687,961 |
5,718,182 |
2,105,976 |
||||
128
Name |
Termination without Cause or Resignation for Good Reason (1) ($) |
Termination as a Result of Death, Disability or Retirement (2) ($) |
Termination Without Cause Within One Year Following a Change in Control (3)
($)
|
Resignation for Good Reason Within One Year Following a Change in Control (3)
($)
|
||||
Darin G. Holderness |
||||||||
Cash Severance (4) |
— |
— |
— |
— |
||||
Pro-Rata Bonus (5) |
200,000 |
— |
— |
— |
||||
COBRA Subsidy (6) |
— |
— |
— |
— |
||||
RSU & PSU Acceleration (7) |
66,814 |
54,563 |
327,420 |
— |
||||
Stock Option Acceleration (7) |
— |
— |
— |
— |
||||
Total |
266,814 |
54,563 |
327,420 |
— |
||||
Jeffrey D. Smith |
||||||||
Cash Severance (4) |
1,175,000 |
— |
1,175,000 |
1,175,000 |
||||
Pro-Rata Bonus (5) |
— |
— |
— |
— |
||||
COBRA Subsidy (6) |
5,976 |
— |
5,976 |
5,976 |
||||
RSU & PSU Acceleration (7) |
— |
645,941 |
1,305,743 |
— |
||||
Stock Option Acceleration (7) |
— |
— |
— |
— |
||||
Total |
1,180,976 |
645,941 |
2,486,719 |
1,180,976 |
||||
David Sledge |
||||||||
Cash Severance (4) |
1,275,000 |
— |
1,275,000 |
1,275,000 |
||||
Pro-Rata Bonus (5) |
— |
— |
— |
— |
||||
COBRA Subsidy (6) |
5,980 |
— |
5,980 |
5,980 |
||||
RSU & PSU Acceleration (7) |
— |
591,503 |
1,185,390 |
— |
||||
Stock Option Acceleration (7) |
— |
— |
— |
— |
||||
Total |
1,280,980 |
591,503 |
2,466,370 |
1,280,980 |
||||
Newton W. “Trey” Wilson |
||||||||
Cash Severance (4) |
700,000 |
— |
1,050,000 |
1,050,000 |
||||
Pro-Rata Bonus (5) |
— |
— |
— |
— |
||||
COBRA Subsidy (6) |
— |
— |
— |
— |
||||
RSU & PSU Acceleration (7) |
— |
54,563 |
327,420 |
— |
||||
Stock Option Acceleration (7) |
— |
— |
— |
— |
||||
Total |
700,000 |
54,563 |
1,377,420 |
1,050,000 |
||||
(1) |
Amounts in this column reflect payments made upon termination by the Company without “Cause” or by the Named Executive Officer for “Good Reason.” For Mr. Gobe, such quoted terms are as defined in the applicable award agreement, and for Messrs. Redman, Smith, Sledge and Wilson, such quoted terms are as defined in his employment agreement, in each case, as described above. For purposes of this table, we are equating a termination without “Cause” or resignation for “Good Reason” with Mr. Holderness’s “good leaver” resignation and have included payments he would receive upon his separation as a “good leaver” in this column only. |
(2) |
Amounts in this column reflect payments made upon termination as a result of the Named Executive Officer’s death, “Disability” or “Retirement.” For Messrs. Gobe and Holderness, such quoted terms are as defined in the applicable award agreement, and for Messrs. Redman, Smith, Sledge and Wilson, “Disability” is as defined in his employment agreement and “Retirement” is defined in the applicable award agreement, in each case, as described above. Currently, only Messrs. Smith and Sledge are Retirement eligible. |
(3) |
Amounts in this column reflect payments made upon termination by the Company without Cause or by the Named Executive Officer for Good Reason, in each case, within 12 months following a “Change in Control.” As described above under “—Incentive Plan Awards,” RSUs, stock options and PSUs granted under the Incentive Plan are accelerated in connection with a Named Executive Officer’s termination without Cause within 12 months following a Change in Control but are not accelerated in connection with a Named Executive Officer’s resignation for Good Reason, whether or not such resignation follows a Change in Control. For purposes of this table, we are including the value of the 12,182 RSUs Mr. Gobe was granted as a director in these columns. However, |
129
these RSUs would vest immediately upon Change in Control, whether or not Mr. Gobe is terminated without Cause within 12 months following such Change in Control.
(4) |
Pursuant to the employment agreements, upon termination of employment by the Company without Cause or by the Named Executive Officer for Good Reason, each Named Executive Officer with an employment agreement will receive the sum of his then current annual base salary and the amount of his annual bonus paid to him for the immediately preceding calendar year (or, for Mr. Wilson, the target amount of his annual bonus for the current calendar year), payable in 12 equal installments over the year following termination. Messrs. Gobe and Holderness are not party to an employment agreement and are not entitled to any cash severance. |
(5) |
Pursuant to the terms of the Holderness Letter Agreement, Mr. Holderness is the only Named Executive Officer eligible to receive a pro-rata bonus, based upon the number of days Mr. Holderness was employed by the Company during the applicable calendar year, upon his separation as a “good leaver,” as described above under “—Holderness Agreements.” The full bonus paid to Mr. Holderness for performance during 2019 is included in the table because it was prorated based upon his service from October 3, 2019 to December 31, 2019 prior to payment. See “Narrative Disclosure to Summary Compensation Table and Grants of Plan-Based Awards Table—Letter Agreements with Messrs. Gobe and Holderness.” |
(6) |
Pursuant to the employment agreements with Messrs. Redman, Smith and Sledge, upon termination of employment by the Company without Cause or by the Named Executive Officer for Good Reason, whether or not within 12 months following a Change in Control, the Company will reimburse the Named Executive Officer for the difference between the cost of the COBRA premiums and the cost for similarly-situated employees to effect such coverage under the Company’s group health plans for up to 12 months following such termination. The COBRA reimbursement amount is based on the premiums in effect on December 31, 2019 and each applicable Named Executive Officer’s elections in place on such date, which are assumed for purposes of this table to remain the same throughout the period for which the COBRA reimbursement would be available. Messrs. Gobe and Holderness are not party to an employment agreement and are not entitled to such benefit, and Mr. Wilson’s employment agreement does not provide for this benefit. |
(7) |
For the RSUs, these amounts are calculated by multiplying the number of RSUs that would have become vested upon the applicable event by $11.25, the closing price of our common stock on December 31, 2019. The unvested stock options have an exercise price of $14.00, which is $2.75 more than the market value of our common stock on December 31, 2019, so the value of any accelerated stock options has not been included in this table. These amounts are calculated for the PSUs by multiplying the number of PSUs that would become vested upon the applicable event by $11.25, the closing price of our common stock on December 31, 2019. The number of PSUs used in such calculation reflects actual performance as of December 31, 2019, which was at target for all outstanding PSUs. However, PSUs that vest as a result of (i) a Named Executive Officer’s death, Disability or Retirement and (ii) Mr. Holderness’ separation from service as a “good leaver” will vest based on actual performance as of the end of the applicable performance period, and, as a result, the amounts included reflect estimated payouts of such PSUs. |
Howell Separation Agreement
On August 30, 2019, Mr. Howell and the Company entered into a Separation and General Release Agreement (the “Howell Separation Agreement”), pursuant to which Mr. Howell’s employment with the Company terminated on September 29, 2019 (the “Howell Separation Date”). Under the Howell Separation Agreement, Mr. Howell became entitled to receive the following benefits, subject to his execution and non-revocation of a release of claims and continued compliance with certain restrictive covenants:
• |
Lump-sum cash payment equal to $725,000, payable shortly following the Howell Separation Date; |
• |
Cash severance equal to $725,000, payable in equal installments during the one-year period following the Howell Separation Date; and |
• |
Partially subsidized continuation coverage for Mr. Howell, his spouse and his eligible dependents under the Company’s group health plans pursuant to COBRA for 12 months following the Howell Separation Date, or if earlier, the date Mr. Howell becomes covered under the group health plan of another employer. |
Upon the Howell Separation Date, Mr. Howell forfeited all unvested equity awards in connection with his separation pursuant to the terms of the Incentive Plan.
The table below quantifies the value of the payments and benefits received or to be received by Mr. Howell pursuant to the Howell Separation Agreement.
Type of Benefits |
Severance Payments($) |
|
Cash Severance |
1,450,000 |
|
COBRA Subsidy (1) |
6,070 |
|
Total |
1,456,070 |
|
(1) |
The COBRA reimbursement amount is based on the premium in effect on the Howell Separation Date and Mr. Howell’s elections in place on such date, which are assumed for purposes of this table to remain the same throughout the 12-month period for which the COBRA reimbursement would be available. |
130
Denholm Separation Agreement
On October 3, 2019, Mr. Denholm and the Company entered into a Separation and General Release Agreement (the “Denholm Separation Agreement”) pursuant to which Mr. Denholm’s employment with the Company terminated on December 8, 2019 (the “Denholm Separation Date”). Pursuant to the terms of the Denholm Separation Agreement, Mr. Denholm continued to receive the base salary and benefits to which he was entitled immediately prior to his resignation as Chief Accounting Officer until the Denholm Separation Date. Further, under the Denholm Separation Agreement, Mr. Denholm became entitled to receive the following benefits, subject to his execution and non-revocation of a release of claims and continued compliance with certain restrictive covenants:
• |
Cash severance equal to $490,000, payable in equal installments during the one-year period following the Howell Separation Date; |
• |
Partially subsidized continuation coverage for Mr. Denholm, his spouse and his eligible dependents under the Company’s group health plans pursuant to COBRA for 12 months following the Denholm Separation Date, or if earlier, the date Mr. Denholm becomes covered under the group health plan of another employer; |
• |
Accelerated vesting of 2,995 stock options granted under the Incentive Plan; |
• |
Accelerated vesting of 2,151 RSUs granted under the Incentive Plan; |
• |
Deemed satisfaction of the applicable service requirement with respect to and accelerated vesting of 4,257 PSUs, based on target performance; and |
• |
Extension of the exercise period of Mr. Denholm’s stock options granted under the Incentive Plan that have become vested and are outstanding as of the Denholm Separation Date such that they shall not be forfeited on the 91st day following the Denholm Separation Date pursuant to the terms of the Incentive Plan but instead shall remain outstanding and eligible to vest until October 3, 2020. |
In addition, the Company agreed to pay Mr. Denholm a lump sum payment equal to the value of all accrued but unused vacation in connection with his separation. Upon the Denholm Separation Date, Mr. Denholm forfeited all other unvested equity awards in connection with his separation pursuant to the terms of the Incentive Plan.
The table below quantifies the value of the payments and benefits received or to be received by Mr. Denholm pursuant to the Denholm Separation Agreement.
Type of Benefits |
Severance Payments ($) |
|
Vacation Payout |
10,682 |
|
Cash Severance |
490,000 |
|
COBRA Subsidy (1) |
6,064 |
|
Stock Option Acceleration (2) |
— |
|
RSU Acceleration (2) |
20,305 |
|
PSU Acceleration (2) |
40,186 |
|
Total |
567,237 |
|
(1) |
The COBRA reimbursement amount is based on the premium in effect on the Denholm Separation Date and Mr. Denholm’s elections in place on such date, which are assumed for purposes of this table to remain the same throughout the 12-month period for which the COBRA reimbursement would be available. |
(2) |
For the RSUs and PSUs, these amounts are calculated by multiplying the number of RSUs and PSUs that were vested on the Denholm Separation Date by $9.44, the closing price of our common stock on the last trading day prior to the Denholm Separation Date. The unvested stock options have an exercise price of $14.00, which is $4.56 more than the market value of our common stock on the Denholm Separation Date, so the value of any accelerated stock options has not been included in this table. |
131
Actions Taken Following December 31, 2019
Redman Separation Agreement
On March 13, 2020, Mr. Redman and the Company entered into a Separation and Release Agreement (the “Redman Separation Agreement”), pursuant to which Mr. Redman’s employment with the Company terminated on March 13, 2020 (the “Redman Separation Date”). Under the Redman Separation Agreement, Mr. Redman became entitled to receive the following benefits, subject to his execution and non-revocation of a release of claims and continued compliance with certain restrictive covenants, including additional restrictive covenants that result in a total of a five-year non-competition and non-solicitation obligation (an increase from the one-year non-competition and three-year non-solicitation obligation set forth in Mr. Redman’s employment agreement):
• |
Lump-sum cash payment equal to $38,217 for his accrued but unused vacation days; |
• |
Extension of the exercise period of Mr. Redman’s stock options granted under the Stock Option Plan and the Incentive Plan that have become vested and are outstanding as of the Redman Separation Date such that they shall not be forfeited on the 91st day following the Redman Separation Date pursuant to the terms of the applicable plans but instead shall remain outstanding and eligible to vest until the one-year anniversary of the Redman Separation Date; |
• |
The ability to exercise his vested and unexercised stock options using a “cashless exercise” during the extended exercise period such that Mr. Redman does not have to deliver any cash to exercise such stock options but the number of shares of common stock delivered by the Company upon the exercise of such stock options shall be reduced by the number of shares equal to the value of the exercise price and the applicable tax withholding; and |
• |
Full reimbursement of the cost of continuation coverage for Mr. Redman, his spouse and his eligible dependents under the Company’s group health plans pursuant to COBRA for 18 months following the Redman Separation Date, or if earlier, the date Mr. Redman becomes covered under the group health plan of another employer. |
Mr. Redman forfeited all unvested equity awards in connection with his separation pursuant to the terms of the Incentive Plan.
The table below quantifies the value of the payments and benefits received or to be received by Mr. Redman pursuant to the Redman Separation Agreement.
Type of Benefits |
Severance Payments ($) |
|
Vacation Payout |
38,217 |
|
Stock Option Extension (1) |
679,239 |
|
“Cashless Exercise” of Stock Options |
— |
|
COBRA Subsidy (2) |
8,965 |
|
Total |
726,421 |
|
(1) |
The value of the stock option extension is equal to the incremental fair value of the modification of such awards, calculated in accordance with FASB ASC Topic 718. |
(2) |
The COBRA reimbursement amount is based on the premium in effect on the Redman Separation Date and Mr. Redman’s elections in place on such date, which are assumed for purposes of this table to remain the same throughout the 18-month period for which the COBRA reimbursement would be available. |
Letter Agreement with Jeffrey D. Smith
Pursuant to the 2020 Smith Letter Agreement and in connection with Mr. Smith’s appointment as Senior Advisor to the Chief Executive Officer, Mr. Smith’s employment agreement was terminated as of March 13, 2020. Mr. Smith is no longer eligible to receive any cash severance benefits upon his termination of employment for any reason. As consideration for the removal of Mr. Smith’s employment agreement, Mr. Smith received the ability to exercise his (i) vested and outstanding stock options under the Stock Option Plan for up to one year following his termination of employment and (ii) vested and outstanding stock options under the Incentive Plan for up to one year following the date he ceases to provide services to the Company, in each case, using a “cashless exercise” such that Mr. Smith does not have to deliver any cash to exercise such stock options but the number of shares of common stock delivered by the Company upon the exercise of such stock options shall be reduced by the number of shares equal to the value of the exercise price and the applicable withholding.
132
Amended Executive Severance Plan
On March 13, 2020, the Board adopted the Executive Severance Plan, pursuant to which the Named Executive Officers are eligible to receive severance payments and benefits, as described in more detail below. On April 10, 2020, the Board adopted the Amended Executive Severance Plan such that the severance amounts payable upon certain terminations of employment are calculated without taking into account any temporary reduction to a participant’s annualized base salary in connection with a general reduction in base salaries that affects all similarly situated employees of the Company in substantially the same proportions, as determined by the Compensation Committee in its sole discretion.
Following the approval of the Executive Severance Plan and the Amended Executive Severance Plan, none of the Named Executive Officers other than Mr. Sledge have an employment agreement with the Company, and Messrs. Gobe, Holderness and Wilson each have entered into a participation agreement with the Company such that Mr. Gobe is a “Tier 1 Executive,” Mr. Holderness is a “Tier 2 Executive” and Mr. Wilson is a “Tier 3 Executive” in the Amended Executive Severance Plan (each quoted term as defined in the Amended Executive Severance Plan and described below).
Upon the Named Executive Officer’s termination without “Cause” or a resignation for “Good Reason” (each as defined in the Amended Executive Severance Plan and described below), participants in the Amended Executive Severance Plan will be eligible to receive the following benefits:
• |
A lump sum cash payment equal to 2.0 (for Tier 1 Executives), 1.5 (for Tier 2 Executives) or 1.0 (for Tier 3 Executives) times the sum of the participant’s (i) annualized base salary then in effect and (ii) target annual bonus for the year in which the termination occurred; |
• |
Any earned but unpaid bonus for the year preceding the year of termination based on the Company’s actual performance, paid at the time such bonuses are paid to all other executives; and |
• |
Reimbursement for a portion of the cost of continuation coverage for the participant and his or her spouse and eligible dependents under the Company’s group health plans pursuant to COBRA for 12 months (or 18 months for Tier 1 Executives), unless such coverage is earlier terminated in accordance with the terms of the Amended Executive Severance Plan. |
Upon a termination without Cause or a resignation for Good Reason within 12 months following a “Change in Control” (as defined in the Amended Executive Severance Plan), participants in the Amended Executive Severance Plan will be eligible to receive the following benefits:
• |
A lump sum cash payment equal to 3.0 (for Tier 1 Executives), 2.0 (for Tier 2 Executives) or 1.5 (for Tier 3 Executives) times the sum of the participant’s (i) annualized base salary then in effect and (ii) target annual bonus as in effect immediately prior to the Change in Control; |
• |
Any earned but unpaid bonus for the year preceding the year of termination based on the Company’s actual performance, paid at the time such bonuses are paid to all other executives; |
• |
A lump sum cash payment equal to a prorated target bonus for the year of termination based on days of service during the applicable calendar year; and |
• |
Full reimbursement of the cost of continuation coverage for the participant and his or her spouse and eligible dependents under the Company’s group health plans pursuant to the COBRA, for 12 months (or 18 months for Tier 1 Executives), unless such coverage is earlier terminated in accordance with the terms of the Amended Executive Severance Plan. |
Additionally, if a participant’s employment with the Company terminates as a result of his or her death or “Disability” (as defined in the Amended Executive Severance Plan), then the participant will be eligible to receive the following benefits:
• |
Any earned but unpaid bonus for the year preceding the year of termination based on the Company’s actual performance, paid at the time such bonuses are paid to all other executives; and |
• |
A lump sum cash payment equal to a prorated target bonus for the year of termination based on days of service during the applicable calendar year. |
In order to receive any of the foregoing severance benefits under the Amended Executive Severance Plan, a participant must timely execute (and not revoke) a release of claims in favor of the Company and its affiliates. Further, the Amended Executive Severance Plan requires continued compliance with certain confidentiality, non-competition, non-solicitation and non-disparagement covenants as set forth in the award agreements under the Incentive Plan. If the severance benefits under the Amended Executive Severance Plan would trigger an excise tax for a participant under Section 4999 or Section 280G of the Internal Revenue Code of 1986,
133
as amended, the Amended Executive Severance Plan provides that the participant’s severance benefits will be reduced to a level at which the excise tax is not triggered, unless the participant would receive a greater amount without such reduction after taking into account the excise tax and other applicable taxes.
As used in the Amended Executive Severance Plan, the following terms generally mean:
• |
“Cause” generally means the Named Executive Officer’s (i) material breach of the employment agreement or any other agreement with the Company or its affiliates, subject to a 30-day notice and 15-day cure period, (ii) material breach of the Company’s or its affiliates’ policies or code of conduct applicable to the Named Executive Officer, (iii) violation of any law applicable to the workplace or employment relationship, (iv) gross negligence, material misconduct reflecting negatively on the Company, breach of fiduciary duty, fraud, theft or embezzlement, (v) conviction of or plea of nolo contendere to any felony (or state law equivalent) or any crime involving moral turpitude, (vi) material failure or refusal (other than due to Disability) to perform obligations or any lawful director from the Board or an officer of the Company, subject to a 30-day notice and 15-day cure period, (vii) unlawful use or possession of illegal drugs on the Company’s premises or while performing duties, (viii) failure to exercise the degree of care, skill and diligence as employees of ordinary skill and knowledge commonly possess and exercise, subject to a 30-day notice and 15-day cure period, or (ix) failure to act with undivided loyalty to the Company and its affiliates. |
• |
“Change in Control” has the meaning given to it under the Incentive Plan. |
• |
“Good Reason” generally means (i) the material diminution in the Named Executive Officer’s base salary, unless in connection with a general reduction in base salaries that affects all similarly situated employees, (ii) material diminution in the Named Executive Officer’s authority, duties, or responsibilities unless in connection with an internal investigation by the Company (provided that his removal from the board of directors or as an officer of any of the Company’s affiliates shall not constitute Good Reason), (iii) the material breach by the Company of any of its obligations under the agreement or (iv) the Named Executive Officer’s relocation by more than 50 miles from his current place of business, in each case, subject to a 30-day notice period, 15-day cure period and the Named Executive Officer’s resignation within 75 days of the end of the cure period. |
• |
“Disability” generally means the Named Executive Officer’s inability to perform the essential functions of his job due to physical or mental impairment for a period that exceeds 120 consecutive days or 180 total days in any 12-month period, as determined by the Board. |
Letter Agreement with David Sledge
On April 9, 2020, the Company entered into the Sledge Letter Agreement whereby, similar to the terms of the Amended Executive Severance Plan, Mr. Sledge’s revised annualized base salary will not be used for purposes of calculating any severance payment that Mr. Sledge may become eligible to receive pursuant to the terms of the Sledge Employment Agreement.
CEO Pay Ratio
2019 CEO Pay Ratio
As of December 31, 2019, the Company employed approximately 2,200 people, all in the United States. Using a consistently applied compensation measure, we determined as of December 31, 2019 the total annual cash compensation of each of our employees (excluding our Former Chief Executive Officer), and then identified the “median employee” within our employee population.
To identify the median compensated employee, we used total annual cash compensation, including base salary, actual bonus paid and overtime and allowances as applicable. Salaries were annualized for those full and part-time employees who did not work for the full year. Reasonable estimates of cash compensation were made for those employees who were hired during 2019 using current base salary and target bonus amounts and any overtime or allowances paid during 2019. Once the median employee was identified, we determined his or her annual total compensation in accordance with Item 402(c)(2)(x) of Regulation S-K as required pursuant to SEC rules, which resulted in annual total compensation for the median employee equal to $92,370 for 2019. This calculation is the same calculation used to determine total compensation for purposes of the 2019 Summary Compensation Table with respect to each of the Named Executive Officers.
Our Former Chief Executive Officer’s 2019 total compensation was $5,724,908. Therefore, the ratio of our Former Chief Executive Officer’s compensation to the median employee’s compensation as 62 to 1 for 2019.
SEC rules do not specify a single methodology for identification of the median employee, and other companies may use assumptions and methodologies that are different from those used by us in calculating their pay ratio. Accordingly, the pay ratio
134
disclosed by other companies may not be comparable to the Company’s pay ratio as disclosed above. Neither the Compensation Committee nor management of the Company used the pay ratio measure in making compensation decisions.
2018 CEO Pay Ratio
Due to the (i) previously inaccurate disclosure of our Former Chief Executive Officer’s total compensation in 2018, as described in “-Summary Compensation Table” and “-Narrative Disclosure to Summary Compensation Table and Grants of Plan-Based Awards Table-Perquisites” and (ii) inadvertent annualization of certain temporary employees’ compensation, the ratio of our Former Chief Executive Officer’s compensation to the median employee’s compensation for 2018 was unintentionally and incorrectly reported as 61 to 1 in our Proxy Statement on Schedule 14A for the fiscal year ended December 31, 2018.
To rectify this oversight in the prior disclosures, the Company has recalculated the ratio of our Former Chief Executive Officer’s compensation to the median employee’s compensation for 2018 using the methodology set forth above in “—2019 CEO Pay Ratio.”
The annual total compensation for the median employee in 2018, as determined in accordance with Item 402(c)(2)(x) of Regulation S-K pursuant to SEC rules, was equal to $104,374. As corrected in the Summary Compensation Table and the footnotes thereto, our Former Chief Executive Officer’s total compensation for 2018, also calculated in accordance with Item 402(c)(2)(x) of Regulation S-K, was $5,750,012. The correct ratio of our Former Chief Executive Officer’s compensation to the median employee’s compensation was 55 to 1 for 2018.
135
Item 12. Security Ownership of Certain Beneficial Owners and Management and Related Stockholder Matters
Principal Stockholders
The following table presents certain information as of June 9, 2020, based on 100,849,840 shares of common stock outstanding as of such date, as to:
• |
each stockholder known by us to be the beneficial owner of more than five percent of our outstanding shares of common stock, |
•each director,
•each Named Executive Officer, and
•all current directors and executive officers as a group.
Shares Beneficially Owned |
|||||
Name of Beneficial Owner (1) |
Number |
Percentage |
|||
5% Stockholders |
|||||
Pioneer Natural Resources Company (2)
|
16,600,000 |
16.5 |
% |
||
BlackRock, Inc. (3)
|
13,105,996 |
13.0 |
% |
||
THRC Holdings, L.P (4)
|
10,000,000 |
9.9 |
% |
||
The Vanguard Group (5)
|
8,874,987 |
8.8 |
% |
||
Directors and Named Executive Officers (6) |
|||||
Phillip A. Gobe |
12,182 |
* |
|||
Darin G. Holderness |
— |
* |
|||
David Sledge |
966,078 |
1.0 |
% |
||
Newton III W. “Trey” Wilson |
— |
* |
|||
Dale Redman (7)
|
1,741,280 |
1.7 |
% |
||
Jeffrey D. Smith (8)
|
1,193,500 |
1.2 |
% |
||
Mark Howell (9)
|
8,634 |
* |
|||
Ian Denholm (10)
|
21,255 |
* |
|||
Spencer D. Armour III |
614,953 |
* |
|||
Mark S. Berg |
— |
* |
|||
Anthony Best |
16,027 |
* |
|||
Pryor Blackwell |
45,453 |
* |
|||
Michele V. Choka |
— |
* |
|||
Alan E. Douglas |
22,179 |
* |
|||
Jack B. Moore |
22,179 |
* |
|||
All Directors and Executive Officers as a group (15 persons)
|
4,663,720 |
4.6 |
% |
||
*Less than 1%.
(1) |
Unless otherwise indicated, the address for each beneficial owners in this table is c/o ProPetro Holding Corp., 1706 S. Midkiff, Midland, Texas 79701. |
(2) |
Based on a Schedule 13D filed on January 7, 2019. Represents shares of our common stock beneficially owned by Pioneer. The shares of our common stock are directly owned by Pioneer Natural Resources Pumping Services LLC, a wholly owned subsidiary of Pioneer Natural Resources USA, Inc., which is a wholly owned subsidiary of Pioneer. The address of Pioneer and its subsidiaries is 5205 N. O’Connor Blvd., Suite 200, Irving, Texas 75039‑3746. |
(3) |
Based on a Schedule 13G filed on February 4, 2020. Represents shares of our common stock held by BlackRock, Inc. and certain of its affiliates, referred to collectively as BlackRock. BlackRock has sole voting power over 12,819,233 shares and sole dispositive power over 13,105,996 shares. The address for BlackRock is 55 East 52nd Street, New York, New York 10055. |
136
(4) |
Based on a Schedule 13G Filed on April 3, 2020. Represents (i) 10,000,000 shares over which THRC Holdings, LP has shared voting power, and has shared dispositive power over 10,000,000 shares. The address for THRC Holdings, LP is 17018 IH 20, Cisco, Texas 76437. |
(5) |
Based on a Schedule 13G Filed on February 12, 2020. Represents (i) 132,418 shares over which The Vanguard Group has sole voting power (ii) 12,081 shares over which The Vanguard Group has shared voting power, (iii) 8,742,895 over which The Vanguard Group has sole dispositive power, and (iv) 132,092 over which The Vanguard Group has shared dispositive power. Vanguard Fiduciary Trust Company, a wholly owned subsidiary of The Vanguard Group, Inc., is the beneficial owner of 120,011 shares as a result of its serving as investment manager of collective trust accounts. Vanguard Investments Australia, Ltd., a wholly owned subsidiary of The Vanguard Group, Inc., is the beneficial owner of 24,488 shares as a result of its serving as investment manager of Australian investment offerings. The address for these entities is 100 Vanguard Blvd., Malvern, Pennsylvania 19355. |
(6) |
For each officer and director, includes shares of common stock that are issuable pursuant to options that are currently exercisable or exercisable within 60 days, and RSUs that are eligible to vest within 60 days. |
(7) |
Mr. Redman resigned from his position as Chief Executive Officer on March 13, 2020. On January 18, 2017, Mr. Redman signed a pledge agreement for 371,200 shares (538,240 shares after the March 2017 stock split) of the Company’s common stock to secure a personal loan. On March 28, 2017, Mr. Redman sold 370,370 shares of the Company’s common stock, as part of the overallotment option exercised by the underwriters in the Company’s initial public offering in March 2017, which brought Mr. Redman’s stock ownership, at that time, to 167,870 shares of the Company’s common stock covered by the pledge agreement, which we believe remains in effect. |
(8) |
Mr. Smith ceased serving as an executive officer on March 13, 2020, but serves as a Special Advisor to the Chief Executive Officer. |
(9) |
Mr Denholm resigned from his position as Chief Accounting Officer on October 3, 2019. Based on information set forth in a Form 4 filed with the SEC on June 11, 2019. |
(10) |
Mr Howell resigned from his position as General Counsel and Corporate Secretary on August 30, 2019. Based on information set forth in a Form 4 filed with the SEC on June 11, 2019. |
Equity Compensation Plan Information
The following table sets forth our issuance of awards under the Stock Option Plan of ProPetro Holding Corp., which was originally adopted in 2013 and subsequently amended (the “Stock Option Plan”) and 2017 Incentive Award Plan as of December 31, 2019:
Plan Category |
Number of securities to be issued upon exercise of outstanding options, warrants and rights (1) |
Weighted average exercise price of outstanding options, warrants and rights |
Number of securities remaining available for future issuance under equity compensation plans (excluding securities reflected in column (a)) |
|||||||
(a) |
(b) |
(c) |
||||||||
Equity compensation plans approved by security holders |
5,435,926 |
$ |
5.03 |
3,227,592 |
||||||
Equity compensation plans not approved by security holders |
— |
— |
— |
|||||||
Total |
5,435,926 |
$ |
5.03 |
3,227,592 |
||||||
___________________
(1) |
Includes 3,622,763 option awards under the Stock Option Plan, and 677,325 option awards, 613,217 restricted share unit awards and 522,621 performance stock unit awards (assuming achievement of target payout of 100%) that have been granted under the 2017 Incentive Award Plan. The weighted average exercise price in column (b) does not take the restricted share unit awards or performance stock unit awards into account. |
137
Item 13. Certain Relationships and Related Party Transactions, and Director Independence.
Related Party Transactions
Corporate Office Building
The Company rents its corporate office building and the associated real property from PD Properties, an entity which Dale Redman (our Former Chief executive Officer) has an equity interest. The rent expense on our corporate office building is approximately $0.1 million per year. During the year ended December 31, 2019, the Company incurred costs of approximately $1.6 million for improvements made to our corporate office building that we rent. In April 2020, the Company acquired the corporate office building and associated real property for approximately $1.5 million.
Operations and Maintenance Yards
The Company also rents five yards from South Midkiff Partners, LLC, an entity jointly owned by Dale Redman, David Sledge (our Chief Operating Officer), Jeff Smith (our Former Chief Financial Officer), and Spencer Armour (a director) and total annual rent expense for each of the five yards was approximately $0.03 million, $0.03 million, $0.1 million, $0.1 million, and $0.2 million, respectively. The Company also leased a yard from Sledge Ranches, LTD, which David Sledge has an equity interest, and with annual lease expense of approximately $0.11 million.
We lease a property adjacent to our corporate headquarters from 4 Industrial Loop Partners, LLC, an entity wholly owned by an affiliate of Bandera Ventures. For the year ended December 31, 2019, we paid approximately $0.4 million under the lease. The lease has a remaining term of approximately four years. Mr. Blackwell, one of our directors, through his approximately 33% interest in Bandera Ventures, may be deemed an indirect beneficiary of this lease.
Transportation and Equipment Rental
For the year ended December 31, 2019, the Company incurred costs for transportation services with Double T Aviation, LLC, an entity in which Dale Redman has an equity interest, of approximately $0.2 million.
The Company also rented equipment in Elk City, Oklahoma for our flowback operations from PD Properties, an entity which Dale Redman has an equity interest. For the year ended December 31, 2019, the Company incurred and paid approximately $0.2 million. This rental arrangement was terminated in January 2020.
Executive Officer Family Members
Jordan Frosch is our Vice President of Sales and Marketing and the son‑in‑law of Dale Redman. Mr. Frosch received total compensation of approximately $469,000 for his services for the year ended December 31, 2019.
Samuel D. Sledge is our Chief Strategy and Administrative Officer and the son of David Sledge. Samuel D. Sledge received total compensation of approximately $627,000 for his services for the year ended December 31, 2019.
David Sledge, our Chief Operating Officer, has a family relationship with an officer of Gravity Oilfield Services, who is an equipment rental vendor to the Company. The total equipment rental services provided by Gravity Oilfield Services to the Company was approximately $177,000 for the year ended December 31, 2019.
Newton III “Trey” Wilson, our General Counsel and Corporate Secretary, has a family relationship with an officer of Concho Resources Inc., who is a customer of the Company. The services provided to Concho Resources Inc. was approximately $527,000 for the year ended December 31, 2019.
Morgan Stovall was our former Corporate Controller and the daughter of Jeffrey D. Smith. Ms. Stovall received total compensation of approximately $438,000 for her services during the year ended December 31, 2019.
138
Pioneer
On December 31, 2018, we consummated the purchase of certain pressure pumping assets and real property in connection with the Pioneer Pressure Pumping Acquisition. In connection with the consummation of the Pioneer Pressure Pumping Acquisition and effective January 1, 2019, we became a long-term service provider to Pioneer, providing pressure pumping and related services for a term of up to ten years. Revenue from services provided to Pioneer was approximately $524.2 million for the year ended December 31, 2019. During 2019, the Company reimbursed Pioneer approximately $4.2 million for our portion of the retention bonuses paid to former Pioneer employees that were subsequently employed by the Company in connection with the Pioneer Pressure Pumping Acquisition.
Sand Supply Agreement
In November 2017, we entered into a five-year extension to an existing and supply agreement to provide Texas-sourced frac sand (“Texas sand”). Texas sand provided under the supply agreement will primarily be sourced from a mine located on land owned by an entity in which Dale Redman owns a 44% noncontrolling equity interest. Accordingly, Mr. Redman may be considered an indirect beneficiary of payments made under the lease between our supplier and the landowner. The supply agreement was negotiated by officers of the Company without the involvement of Mr. Redman, and reviewed and approved by the Audit Committee pursuant to its authority under our Related Party Transaction Policy. In considering the approval of the supply agreement, the Audit Committee retained independent legal and commercial expertise to assist in the evaluation of the agreement’s commercial terms. Following its evaluation, the Audit Committee determined that the pricing and other provisions of the agreement reflected market terms, that the agreement reflected an arm’s length negotiation, and that entry into the agreement was advisable and in the best interests of the Company. For the year ended December 31, 2019, the Company purchased approximately $44.3 million of Texas sand under the supply agreement, and Mr. Redman was an indirect beneficiary of approximately $1.5 million.
Policies and Procedures for Related Party Transactions
Any request for us to enter into a transaction with an executive officer, director, principal stockholder or any of such persons’ immediate family members or affiliates, among others, in which the amount involved exceeds $120,000, must first be presented to our Audit Committee for review, consideration and approval. All of our directors and executive officers are required to report to the Audit Committee chair any such related person transaction. In approving or rejecting the proposed agreement, our Audit Committee shall consider the facts and circumstances available and deemed relevant to the Audit Committee, including, but not limited to, whether the transaction is on terms comparable to those that could be obtained in arm’s‑length dealings with an unrelated third party, the extent of the related party’s interest in the transaction and the conflicts of interest and corporate opportunity provisions of our certificate of incorporation. If we should discover related person transactions that have not been approved, the Audit Committee will be notified and will determine the appropriate action, including ratification, revision or termination of such transaction.
Director Independence
The majority of the members of the Board, at any given time, must qualify as “independent” under the rules of the NYSE.
Our Board has undertaken a review of the independence of each of our directors and has affirmatively determined that each of Messrs. Best, Blackwell, Douglas, Moore and Ms. Choka are “independent,” as defined by the NYSE rules. Under the NYSE rules, a director can be independent only if (a) the director does not trigger a categorical bar to independence and (b) our Board affirmatively determines that the director has no material relationship with the Company (either directly or as a partner, shareholder or officer of an organization that has a relationship with the Company).
Based on information provided by the directors concerning their background, employment and affiliations, our Board has determined that these directors do not have a material relationship with the Company (either directly or as a partner, shareholder or officer of an organization that has a relationship with the Company). In making this
139
determination, our Board considered the current and prior relationships that each of the directors has with us, and all other facts and circumstances our Board deemed relevant in determining independence, including any beneficial ownership of our capital stock by each of the directors.
140
Item 14. Principal Accounting Fees and Services
The following table sets forth the fees incurred by us in fiscal years 2019 and 2018 for services performed by Deloitte & Touche LLP:
Year Ended December 31, |
|||||||
2019 |
2018 |
||||||
Audit Fees (1) |
$ |
2,842,660 |
$1,481,585 |
||||
Audit-Related Fees (2) |
2,960,884 |
— |
|||||
All Other Fees (3) |
204,621 |
49,359 |
|||||
Total Fees |
$ |
6,008,165 |
$ |
1,530,944 |
|||
(1) |
Audit Fees include fees billed for professional services rendered for the audit of our annual consolidated financial statements, the audit of our system of internal control over financial reporting, the review of interim consolidated financial statements included in our quarterly reports, consents and comfort letters provided in connection with the filing of registration statements, other related services that are normally provided in connection with statutory and regulatory filings, and related out‑of‑pocket expenses. |
(2) |
Audit-Related Fees include fees billed for professional services rendered in connection with the Expanded Audit Committee Review, and related out‑of‑pocket expenses. |
(3) |
All Other fees consisted principally of fees for tax compliance and tax advice. |
REPORT OF THE AUDIT COMMITTEE
The Audit Committee assists our Board in overseeing (i) the integrity of our consolidated financial statements, (ii) our compliance with legal and regulatory requirements, (iii) the independent auditor’s qualifications and independence, (iv) the performance of our independent auditor, and (v) the design and implementation of the Company’s internal audit function, and the performance of the internal audit function after it has been established. In so doing, it is the responsibility of the Audit Committee to maintain free and open communication between the directors, the independent auditor and our financial management. The Audit Committee is directly responsible for the appointment, compensation, retention and oversight of the work of the independent auditor for the purpose of preparing or issuing an audit report or performing other audit, review or attest services for us. The independent auditor reports directly to the Audit Committee.
Management is responsible for the preparation, presentation, and integrity of our consolidated financial statements, accounting and financial reporting principles, internal control over financial reporting, and procedures designed to ensure compliance with accounting standards, applicable laws, and regulations. Management is also responsible for objectively reviewing and evaluating the adequacy, effectiveness, and quality of our system of internal control over financial reporting. Our independent auditor, Deloitte & Touche LLP, is responsible for performing an independent audit of the consolidated financial statements.
The Audit Committee’s responsibility is to monitor and oversee these processes and the engagement, independence and performance of our independent auditor. The Audit Committee relies, without independent verification, on the information provided to it and on the representations made by management and the independent auditor.
The Audit Committee has met with our independent auditor and discussed the overall scope and plans for their audit. The Audit Committee met with the independent auditor to discuss matters required to be discussed with audit committees under generally accepted auditing standards, including, among other things, matters related to the conduct of the audit of our consolidated financial statements and the matters required to be discussed by the statement on Auditing Standards No. 1301, as adopted by the Public Company Accounting Oversight Board.
Our independent auditor also provided to the Audit Committee the written disclosures and the letter required by applicable standards of the Public Company Accounting Oversight Board regarding the independent auditor’s
141
communications with the Audit Committee concerning independence, and the Audit Committee discussed with the independent auditor its independence. When considering the independence of Deloitte & Touche LLP, the Audit Committee considered the non‑audit services provided to the Company by the independent auditor and concluded that such services are compatible with maintaining the auditor’s independence.
The Audit Committee has reviewed and discussed our audited consolidated financial statements for the fiscal year ended December 31, 2019 with management and Deloitte & Touche LLP. Based on the Audit Committee’s review of the audited consolidated financial statements and the meetings and discussions with management and the independent auditors, and subject to the limitations on the Audit Committee’s role and responsibilities referred to above and in the Audit Committee Charter, the Audit Committee recommended to our Board that our audited consolidated financial statements be included in this Annual Report on Form 10‑K.
By the Audit Committee of the Board of Directors, |
|
Anthony Best (Chair) |
|
Alan E. Douglas |
|
Jack B. Moore |
|
Policy on Audit Committee Pre‑Approval of Audit and Non‑Audit Services of Independent Registered Public Accounting Firm
The charter of the Audit Committee and its pre‑approval policy require that the Audit Committee review and pre‑approve the Company’s independent registered public accounting firm’s audit fees, audit‑related fees, tax fees and fees for other services. The Chairman of the Audit Committee has the authority to grant pre‑approvals that are within the pre‑approval policy and are presented to the Audit Committee at a subsequent meeting. For the year ended December 31, 2019, the Audit Committee approved 100% of the services described above under the captions “Audit Fees,” “Audit-Related Fees” and “All Other Fees”.
142
Part IV
Item 15. Exhibits and Financial Statement Schedules.
(a)(1) Financial Statements
The Financial Statements in Item 8 are filed as part of this Annual Report.
(a)(2) Financial Statement Schedules
None.
(a)(3) Exhibits
The exhibits required to be filed by this Item 15(b) are set forth in the Exhibit Index included below.
(b) See Exhibit Index
(c) None
143
EXHIBIT INDEX
Exhibit Number |
Description |
|
2.1 |
||
3.1 |
||
3.2 |
||
3.3 |
||
4.1 |
||
4.2 |
||
4.3 |
||
4.4(a) |
||
4.5 |
||
10.1 |
||
10.2# |
||
10.3# |
||
10.4# |
||
10.5# |
||
10.6# |
||
10.7# |
||
10.8# |
||
10.9# |
||
144
10.10# |
||
10.11# |
||
10.12# |
||
10.13# |
||
10.14# |
||
10.15# |
||
10.16# |
||
10.17# |
||
10.18# |
||
10.19# |
||
10.20# |
||
10.21# |
||
10.22# |
||
10.23#(a) |
||
10.24# |
||
10.25# |
||
10.26#(a) |
||
10.27#(a) |
||
10.28#(a) |
||
10.29#(a) |
||
10.30#(a) |
||
10.31# |
||
145
10.32# |
||
10.33# |
||
10.34# |
||
10.35# |
||
10.36# |
||
10.37# |
||
10.38# |
||
10.39# |
||
10.40# |
||
10.41# |
||
10.42# |
||
10.43#(a) |
||
10.44 |
||
10.45 |
||
10.46 |
||
10.47 |
||
10.48 |
||
10.49# |
||
10.50# |
||
10.51#(a) |
||
10.52# |
||
146
10.53#(a) |
||
10.54#(a) |
||
10.55#(a) |
||
10.56# |
||
21.1(a) |
||
23.1(a) |
||
31.1(a) |
||
31.2(a) |
||
32.1(b) |
||
32.2(b) |
||
101.INS(a) |
XBRL Instance Document |
|
101.SCH(a) |
XBRL Taxonomy Extension Schema Document |
|
101.CAL(a) |
XBRL Taxonomy Extension Calculation Linkbase Document |
|
101.LAB(a) |
XBRL Taxonomy Extension Label Linkbase Document |
|
101.PRE(a) |
XBRL Taxonomy Extension Presentation Linkbase Document |
|
101.DEF(a) |
XBRL Taxonomy Extension Definition Linkbase Document |
|
104(a) |
Cover Page Interactive Data File - the cover page interactive data file does not appear in the Interactive Data File because its XBRL tags are embedded within the Inline XBRL document |
|
(a) Filed herewith.
(b) Furnished herewith.
# Compensatory plan, contract or arrangement.
Item 16. Form 10-K Summary
None.
147
SIGNATURES
Pursuant to the requirements of the Securities Exchange Act of 1934, the registrant has duly caused this Annual Report on Form 10-K to be signed on its behalf by the undersigned, thereunto duly authorized, on June 19, 2020.
ProPetro Holding Corp.
/s/ Phillip A. Gobe |
Phillip A. Gobe Chief Executive Officer and Chairman of the Board |
Pursuant to the requirements of the Securities Exchange Act of 1934, as amended, this Annual Report on Form 10-K has been signed by the following persons in the capacities indicated on the date indicated.
Signature |
Title |
Date |
/s/ Phillip A. Gobe |
Chief Executive Officer and Chairman of the Board (Principal Executive Officer) |
June 19, 2020 |
Phillip A. Gobe |
||
/s/ Darin G. Holderness |
Chief Financial Officer (Principal Financial Officer) |
June 19, 2020 |
Darin G. Holderness |
||
/s/ Elo Omavuezi |
Chief Accounting Officer (Principal Accounting Officer) |
June 19, 2020 |
Elo Omavuezi |
||
/s/ Spencer D. Armour |
Director |
June 19, 2020 |
Spencer D. Armour, III |
||
/s/ Mark Berg |
Director |
June 19, 2020 |
Mark Berg |
||
/s/ Anthony Best |
Director |
June 19, 2020 |
Anthony Best |
||
/s/ Pryor Blackwell |
Director |
June 19, 2020 |
Pryor Blackwell |
||
/s/ Michele V. Choka |
Director |
June 19, 2020 |
Michele V. Choka |
||
/s/ Alan E. Douglas |
Director |
June 19, 2020 |
Alan E. Douglas |
||
/s/ Jack Moore |
Director |
June 19, 2020 |
Jack Moore |
||
148